
Nyheter
Fundamentals of Exchange Traded Funds
Exchange Traded Funds (ETFs) offer an approach to investing that combines instant diversification with trading flexibility, reduced expenses, and improved tax efficiency. Fundamentals of Exchange Traded Funds.
WHAT ARE ETFs?
An ETF is a collection of securities that tracks, and is intended to represent, the performance of a broad or specific segment of the market (e.g., US equities, small cap stocks or emerging markets).
An ETF is similar to an index mutual fund but trades like a stock throughout the day. ETFs combine the features of index mutual funds with individual securities:
Like index mutual funds, ETFs allow investors to track hundreds of domestic and international indexes, including the S&P 500® and the Dow Jones U.S. Total Stock Market IndexSM, as well as specific sectors or industries (e.g., utilities, technology, or healthcare).
Like individual stocks, ETFs give investors the flexibility to buy and sell on the major stock exchanges throughout the day, at the market price. Like stocks, investors can place stop loss and limit orders on ETFs. They can even be bought on margin and sold short, subject to your broker’s terms and conditions.

(Click to enlarge)

(Click to enlarge)
*Morningstar. Average Prospectus Net Expense Ratio for ETFs and open end mutual funds as defined by Morningstar. Data as of 9/30/2014. Average Net Prospectus Expense Ratio for US ETFs and US Mutual Funds as defined by Morningstar.
Unlike a stock, Index ETFs and mutual funds are managed funds that follow a passive investment strategy, attempting to track the performance of an unmanaged index of securities. As a result, the Funds may hold constituent securities of the Index regardless of the current or projected performance of a specific security.
ETFs trade like a stock and will fluctuate in market value over the course of the trading day, unlike an index mutual fund. ETFs may trade at prices below or above the ETF net asset value. Buying shares of an Index ETF, similar to buying a stock, will typically involve brokerage commissions to which index mutual funds may not be subject. Frequent trading of ETFs could significantly increase commissions and other costs.
THE POTENTIAL BENEFITS OF EXCHANGE TRADED FUNDS
DIVERSIFICATION. ETFs offer one of the easiest ways to diversify a portfolio, especially for investors who want to focus on a specific sector or industry. By virtue of being index investments, ETFs offer exposure to a particular market segment, helping to protect against the risk of a select number of individual stocks hurting an investor’s overall portfolio performance. It’s important to remember that diversification does not ensure a profit or guarantee against loss.
LOWER FEES AND EXPENSES. Because most ETFs are passively managed, they typically have low management fees and operating expenses. However, frequent trading of ETFs could significantly increase commissions and other costs such that they may offset any savings from low fees or costs.
TRADING FLEXIBILITY. ETFs trade all day long, so investors can lock in the market value of the ETF anytime during the trading day. Because ETFs trade like stocks on an exchange, a wider range of techniques (short selling, stop loss and limit orders) can be used to take advantage of anticipated market movements. It’s important to keep in mind that frequent ETF trading, which typically occurs through a broker, can significantly increase brokerage commissions potentially washing away any savings from low fees or costs.
TRANSPARENCY. Investors have all the information they need to make informed investments—no strategy drift or black boxes to decipher. With ETFs, you know precisely which securities the ETF holds and what you’re invested in—there is no need to wait for the end of the quarter to review the fund’s holdings.
TAX EFFICIENCY. The ETF investor decides when to sell his or her ETF shares and much like a stock transaction the individual controls the timing of any taxes on any resulting capital gain/loss. Unlike mutual fund investors, ETF buyers and sellers usually don’t assume as high a tax burden for fellow shareholder redemptions. In this case, the resulting capital gains tax burden would be shared by all of the ETF’s investors.**
DEFINITIONS
FLEXIBLE TRADING OPTIONS
Ease and efficiency with which one can purchase a security. ETFs, like stocks, trade on an exchange and can be bought and sold at any point during trading hours at their current market value. Buy and sell orders for mutual fund shares are placed and transacted after the market close at the mutual fund’s closing market value, where the closing value is calculated at the end of the trading day.
Source: “State Street Global Advisors ETFs: A Brief Introduction”.
TAX TREATMENTS
Tax consequences related to the trading of securities. Turnover of individual stocks will have either short term or capital gains tax consequences for the individual investor only. Similarly, holders of ETFs will not typically be affected by other shareholder redemptions. With a mutual fund, if multiple shareholders redeem their shares concurrently, the fund manager may have to sell underlying holdings to raise cash to pay those shareholders; in addition to transaction costs, this could trigger capital gains. The taxes on those capital gains would then be absorbed by all shareholders in the fund.
Source: “State Street Global Advisors ETFs: A Brief Introduction”.
INDEX DEFINITIONS
S&P 500 INDEX
The S&P 500 Index is an unmanaged index of 500 common stocks that is generally considered representative of the US stock market. The index is heavily weighted towards stocks with large market capitalizations and represents approximately two-thirds of the total market value of all domestic common stocks. The S&P 500 Index figures do not reflect any fees, expenses or taxes.
Source: standardandpoors.com.
DOW JONES U.S. TOTAL STOCK MARKET INDEX
The Dow Jones U.S. Total Stock Market Index represents the broadest index for the US equity market, measuring the performance of all US equity securities with readily available price data. Over 5,000 capitalization weighted security returns are used to adjust the index.
Source: dowjonesindexes.com.
TALK TO YOUR FINANCIAL ADVISOR
If exchange traded funds interest you, speak to your advisor to determine if you could benefit from incorporating ETFs in your investment plans.
Your advisor can help you analyze your current investments, risk tolerance, tax situation and time horizon, and then recommend strategies to help you achieve your goals.
ABOUT SPDR® ETFs
SPDR ETFs are a comprehensive fund family of over 100 ETFs, spanning an array of international and domestic asset classes. Offered by State Street Global Advisors, SPDR ETFs provide investors with the flexibility to select investments that are precisely aligned to their investment strategy. Recognized as the industry pioneer, State Street Global Advisors created the first ETF in 1993 (SPDR S&P 500®—Ticker SPY). Since then, we’ve sustained our place as an industry innovator through the introduction of many ground-breaking products, including first-to-market launches with gold, international real estate, international fixed income and sector ETFs.
For information about our ETF family, visit spdrs.com.
STATE STREET GLOBAL ADVISORS
State Street Financial CenterOne Lincoln StreetBoston, MA 02111
866.787.2257spdrs.com
** Like mutual funds, though, there may be times when changes in the underlying index trigger the sale of securities held by the ETF.
FOR PUBLIC USE.
IMPORTANT RISK INFORMATION
ETFs trade like stocks, fluctuate in market value and may trade at prices above or below the ETFs’ net asset value. Brokerage commissions and ETF expenses will reduce returns.
Passive management and the creation/redemption process can help minimize capital gains distributions.
Frequent trading of ETFs could significantly increase commissions and other costs such that they may offset any savings from low fees or costs.
The use of short selling entails a high degree of risk, may increase potential losses and is not suitable for all investors. Please assess your financial circumstances and risk tolerance prior to short selling.
Information represented in this piece does not constitute legal, tax, or investment advice. Investors should consult their legal, tax, and financial advisors before making any financial decisions. Performance of an index is not illustrative of any particular investment. It is not possible to invest directly in an index.
Foreign investments involve greater risks than US investments, including political and economic risks and the risk of currency fluctuations, all of which may be magnified in emerging markets.
Standard & Poor’s and S&P are registered trademarks of Standard & Poor’s Financial Services LLC (“S&P”) and Dow Jones is a registered trademark of Dow Jones Trademark Holdings LLC (“Dow Jones”) and have been licensed for use by S&P Dow Jones Indices LLC and sublicensed by SSgA. The Dow Jones US Total Stock Market Index is a product of S&P Dow Jones Indices LLC, and has been licensed by SSgA.
“SPDR” is a registered trademark of Standard & Poor’s Financial Services LLC (“S&P”) and has been licensed for use by State Street Corporation. STANDARD & POOR’S, S&P and S&P 500 are registered trademarks of Standard & Poor’s Financial Services LLC. No financial product offered by State Street Corporation or its affiliates is sponsored, endorsed, sold or promoted by S&P or its affiliates, and S&P and its affiliates make no representation, warranty or condition regarding the advisability of buying, selling or holding units/shares in such products. Further limitations and important information that could affect investors’ rights are described in the prospectus for the applicable product.
Distributor: State Street Global Markets, LLC, member FINRA, SIPC, a wholly owned subsidiary of State Street Corporation. References to State Street may include State Street Corporation and its affiliates. Certain State Street affiliates provide services and receive fees from the SPDR ETFs. ALPS Distributors, Inc., a registered broker-dealer, is distributor for SPDR S&P 500, SPDR S&P MidCap 400 and SPDR Dow Jones Industrial Average, and all unit investment trusts. ALPS Portfolio Solutions Distributor, Inc. is distributor for Select Sector SPDRs. ALPS Distributors, Inc. and ALPS Portfolio Solutions Distributor, Inc. are not affiliated with State Street Global Markets, LLC.
Before investing, consider the funds’ investment objectives, risks, charges and expenses. To obtain a prospectus or summary prospectus which contains this and other information, call 866.787.2257 or visit spdrs.com. Read it carefully.
© 2014 State Street Corporation. All Rights Reserved. ID2455-IBG-13234 Exp. Date: 11/30/2015 IBG.EDU.FETF.1114 Fundamentals of Exchange Traded Funds


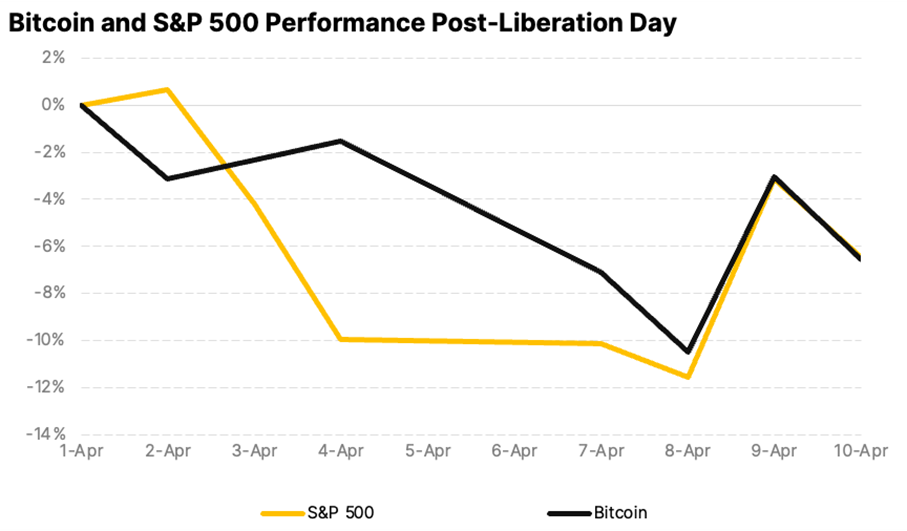
Since U.S. President Donald Trump announced tariffs on April 2, termed ”Liberation Day,” global markets have experienced significant volatility. The S&P 500 shed $5.83 trillion in market value over just four days, marking its steepest drop since the 1950s. Asian markets saw their worst session since 2008, reflecting widespread fears of an economic slowdown.
The U.S. 10-year Treasury yields initially fell below 4% as investors sought safety, but by April 8-9, they surged to a seven-week high of 4.515%. This spike, driven by bond market sell-offs potentially from basis trading or China’s strategic moves to pressure U.S. negotiations, suggests a precarious economic situation rather than risk-on sentiment.
On April 9, President Trump announced a 90-day pause on tariffs for most countries (excluding China, where tariffs jumped to 145%) in an effort to give markets time to absorb the changes and calm volatility. The move sparked a broad rally, with the S&P 500 surging 9.5% for its best day since 2008 and Bitcoin rebounding above $80,000 after a turbulent stretch.
Bitcoin is macro now
Despite persistent concerns about crypto volatility, Bitcoin’s price over the past two weeks has closely mirrored the S&P 500 and has actually been less volatile. This alignment reflects Bitcoin’s growing maturity as an asset class and highlights its resilience. As a highly liquid and accessible asset, it continues to attract investors looking for relative value in turbulent markets.
Sentiment shifts toward crypto ETFs
Spot Bitcoin ETFs recorded $700 million in outflows, while Ethereum ETFs lost $400 million since March, marking a sharp reversal after nine consecutive months of inflows. The pullback points to growing institutional caution amid broader macro uncertainty. Still, on-chain data reveals that long-term holders have been steadily accumulating since January lows, signaling continued confidence in the asset class.
Macroeconomic uncertainty takes center stage
The latest U.S. CPI print came in at 2.4%, which was lower than expected. A rate cut in May still seems premature as markets assess the full impact of new protectionist measures. Federal Reserve Chair Jerome Powell has warned that tariffs could raise inflation while slowing growth. As a result, the probability of three rate cuts in 2025 now exceeds 60%. Declining yields may be an early signal of future monetary easing, which could favor risk assets like crypto if economic pressures intensify.
Bitcoin: Dollar’s ally or alternative?
In the face of policy uncertainty, the debate around the U.S. dollar’s reserve currency status is gaining momentum. With its decentralized and censorship-resistant design, Bitcoin is emerging as both a potential complement and challenger to the dollar, especially as the U.S. increasingly wields its currency as a geopolitical tool through tariffs and sanctions.
Meanwhile, Bitcoin’s fundamentals remain solid. Hashrate is at all-time highs, regulatory clarity is improving, and long-term holders continue to accumulate. With prices consolidating above $80K, the current correction may offer a strategic opportunity for investors positioning for the next leg of growth, particularly as the macro picture evolves.
Research Newsletter
Each week the 21Shares Research team will publish our data-driven insights into the crypto asset world through this newsletter. Please direct any comments, questions, and words of feedback to research@21shares.com
Disclaimer
The information provided does not constitute a prospectus or other offering material and does not contain or constitute an offer to sell or a solicitation of any offer to buy securities in any jurisdiction. Some of the information published herein may contain forward-looking statements. Readers are cautioned that any such forward-looking statements are not guarantees of future performance and involve risks and uncertainties and that actual results may differ materially from those in the forward-looking statements as a result of various factors. The information contained herein may not be considered as economic, legal, tax or other advice and users are cautioned to base investment decisions or other decisions solely on the content hereof.


iShares och Franklin Templeton listar nya ETFer på Xetra

BE28 ETF företagsobligationer med förfall 2028 och inget annat

Trump’s trade war puts Bitcoin in the spotlight

YCSH ETF är en satsning på den europeiska dagslåneräntan

Crypto’s stress-tested resilience

Fonder som ger exponering mot försvarsindustrin
Crypto Market Risks & Opportunities: Insights on Bybit Hack, Bitcoin, and Institutional Adoption

Warren Buffetts råd om vad man ska göra när börsen kraschar

Montrose storsatsning på ETFer fortsätter – lanserar Sveriges första globala ETF med hävstång

Svenskarna har en ny favorit-ETF
-
 Nyheter4 veckor sedan
Fonder som ger exponering mot försvarsindustrin
-

 Nyheter3 veckor sedan
Crypto Market Risks & Opportunities: Insights on Bybit Hack, Bitcoin, and Institutional Adoption
-
 Nyheter3 veckor sedan
Warren Buffetts råd om vad man ska göra när börsen kraschar
-
 Nyheter2 veckor sedan
Montrose storsatsning på ETFer fortsätter – lanserar Sveriges första globala ETF med hävstång
-
 Nyheter3 veckor sedan
Svenskarna har en ny favorit-ETF
-

 Nyheter4 veckor sedan
HANetf lanserar Europa-fokuserad försvars-ETF
-

 Nyheter2 veckor sedan
MONTLEV, Sveriges första globala ETF med hävstång
-

 Nyheter3 veckor sedan
Fastställd utdelning i MONTDIV mars 2025