
Nyheter
Fallen Angels Retain Their Halos in 2015

Fallen Angels Retain Their Halos in 2015 ETFs is authored by VanEck thought leaders. VanEck is the sponsor of Market Vectors ETFs and is currently among the largest providers of exchange traded funds (ETFs) in the U.S. and worldwide. Market Vectors ETFs empower investors to help build better portfolios with access to compelling investment themes and strategies. Our ETFs span many global asset classes, and are built to be transparent, liquid, and pure-play reflections of target markets.
Authored by Meredith Larson, Product Manager, ETFs
Performance Helped by Higher Credit Quality and Lower Energy Exposure
Fallen angels, corporate high yield bonds that were originally issued with investment grade credit ratings, proved more resilient than the broad high yield bond market in 2015.
Generally characterized by higher average credit quality than the broad high yield bond market, fallen angels outperformed by approximately 1.40%, as measured by the BofA Merrill Lynch US Fallen Angel High Yield Index (-3.24%) versus the BofA Merrill Lynch US High Yield Index (-4.64%). Higher average credit quality, lower average exposure to the energy sector, and higher average credit quality within the energy sector were main factors that helped fallen angels end the year ahead of the broad high yield bond market.
Less Weight in Exploration & Production
While the energy sector allocation among fallen angels increased in 2015 (from 4.3% to 13.3%) as the broad high yield bond market’s decreased (from 13.3% to 10.9%), it was fallen angels’ significantly lower yearend industry weight in exploration and production (E&P) that primarily contributed to outperformance. At 0.48%, fallen angels were less exposed to E&P than the broad high yield bond market, which ended 2015 with 4.89% in E&P, arguably one of the energy sector’s more vulnerable industries to the oil price collapse.
Declining oil and commodity prices had a greater relative impact on fallen angels’ 4Q 2015 performance, as fallen angels underperformed the broad high yield bond market by 74 basis points. While the energy sector grew from fallen angel entrants throughout 2015, none were E&P bonds. Furthermore, the fallen angel universe maintained its higher average credit quality, ending 2015 with 81.6% in BB-rated (below investment grade) bonds versus the broad high yield bond market’s 48.4%.
Sector Biases Drove Fallen Angel Performance in 2015
The main drivers of fallen angels’ performance relative to the broad high yield bond market remained consistent throughout 4Q and 2015. Based on average sector weights:
• Positive Influences
• Energy (underweight)
• Banking (overweight)
• Financial Services (overweight)
• Negative Influences
• Basic Industry (overweight)
• Healthcare (underweight)
• Media (underweight)
Sector Return Attribution (%):
Fallen Angels Relative to the Broad High Yield Bond Market

(Click to enlarge) Source: FactSet. Data as of December 31, 2015. Past performance is no guarantee of future performance. Top and bottom five sector attribution of the BofA Merrill Lynch US Fallen Angel High Yield Index for fallen angels versus the BofA Merrill Lynch US High Yield Index for the broad high yield bond market. Figures are gross of fees, non-transaction based and therefore estimates only. Past performance is not indicative of future results.
Attribution represents the opportunity cost of investment positions in a group relative to the overall benchmark.
While fallen angels had lower average energy exposure in 2015, fallen angel bonds from two energy sector issuers entered the index in January, increasing the allocation to 14.4% versus the broad high yield bond market’s 10.4%, as of January 31, 2016.
What are Fallen Angel Bonds?
Watch this educational video on fallen angel bonds and the investment opportunities they may offer.
”…In a way, fallen angel investing is a contrarian strategy. You’re buying bonds that have crossed over from investment grade to high yield and that have seen a lot more selling than buying in the months leading up to the crossover.”
Learn More About ANGL
Additional resources and information on Market Vectors® Fallen Angel High Yield Bond ETF (ANGL) »


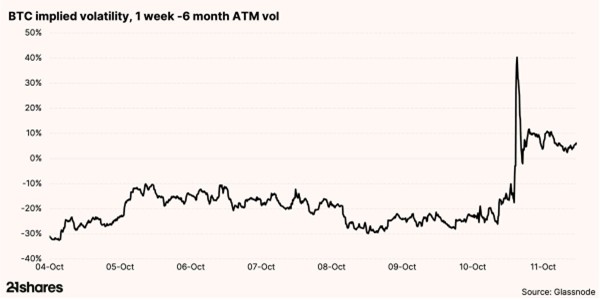
During and after the US market close on Friday, cryptocurrency markets experienced their largest liquidation event on record, with an estimated $19 billion in leveraged positions unwound across futures and perpetual swap markets.

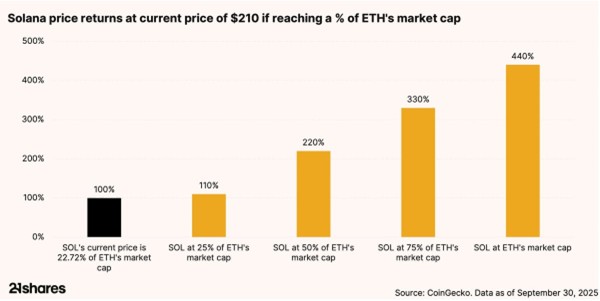
We expect Solana to reach beyond $330. Here’s why
Solana’s growth is underpinned by real fundamentals – measurable cash flows, rising user activity, and expanding economic metrics that rival multibillion dollar growth-tech companies. As Solana transitions from a speculative narrative to a revenue-generating powerhouse, traditional valuation tools like discounted cash flow (DCF) models are becoming increasingly relevant in assessing its long-term potential.


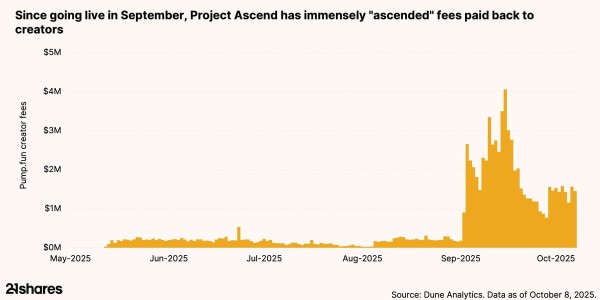
Tokenized attention: Pump.fun and the rise of Creator Capital Markets
The internet’s most valuable commodity is attention – and in 2025, that attention is becoming tokenized. Few projects embody this transformation more vividly than Pump.fun, a Solana-based platform that began as a meme-coin launchpad and has rapidly evolved beyond that use case. Launching Project Ascend in September, Pump.fun introduced Creator Capital Markets (CCM) – a suite of tools that lets streamers and influencers tokenize their audiences.

Research Newsletter
Each week the 21Shares Research team will publish our data-driven insights into the crypto asset world through this newsletter. Please direct any comments, questions, and words of feedback to research@21shares.com
Disclaimer
The information provided does not constitute a prospectus or other offering material and does not contain or constitute an offer to sell or a solicitation of any offer to buy securities in any jurisdiction. Some of the information published herein may contain forward-looking statements. Readers are cautioned that any such forward-looking statements are not guarantees of future performance and involve risks and uncertainties and that actual results may differ materially from those in the forward-looking statements as a result of various factors. The information contained herein may not be considered as economic, legal, tax or other advice and users are cautioned to base investment decisions or other decisions solely on the content hereof.


JEYH ETF är högavkastande obligationer hedgade i euro

Record crypto liquidations amid tariff shock

VALOUR VIRTUAL SEK följer priset på VIRTUAL, Virtuals Protocols egna token

Crypto market update: record liquidations amid tariff shock

Hur investera i Blockchain med hjälp av börshandlade fonder

HANetf och Infrastructure Capital Advisors samarbetar för att lansera aktivt förvaltad preferensavkastnings-ETF i Europa

IN0A ETF spårar S&P 500 med fokus på företag med höga ESG-betyg

YSLV ETP ställer ut köpoptioner på silver för att skapa en löpande avkastning

De bästa lågvolatilitets ETFer på marknaden
PLTY ETP utfärdar optioner mot aktier i Palantir
-
 Nyheter4 veckor sedan
HANetf och Infrastructure Capital Advisors samarbetar för att lansera aktivt förvaltad preferensavkastnings-ETF i Europa
-
 Nyheter4 veckor sedan
IN0A ETF spårar S&P 500 med fokus på företag med höga ESG-betyg
-
 Nyheter4 veckor sedan
YSLV ETP ställer ut köpoptioner på silver för att skapa en löpande avkastning
-
 Nyheter3 veckor sedan
De bästa lågvolatilitets ETFer på marknaden
-

 Nyheter4 veckor sedan
PLTY ETP utfärdar optioner mot aktier i Palantir
-

 Nyheter4 veckor sedan
Time in Bitcoin beats timing Bitcoin
-

 Nyheter4 veckor sedan
Investera i NEAR med en börshandlad produkt
-

 Nyheter4 veckor sedan
HANetf kommenterar kopparuppgången