
Nyheter
Ethermine to Pull Plug on PoW Forks, NFTs in Collateral Face Potential Liquidations, and More!
Last week saw a downtrend in returns and TVL of most assets and protocols in major crypto categories. Over the past seven days, Bitcoin and Ethereum have declined in price by 12.6% and 18.9% respectively. The top 3 cryptoassets within these categories are Binance Coin, Polygon, and Maker, who are down by 7.4%, 21.5%, and 20.8%. However, Polygon was the only asset to have a slight increase in its assets under management, with a 0.24% increase.
Figure 1: 7-Day Price and TVL Developments of Cryptoassets in Major Sectors
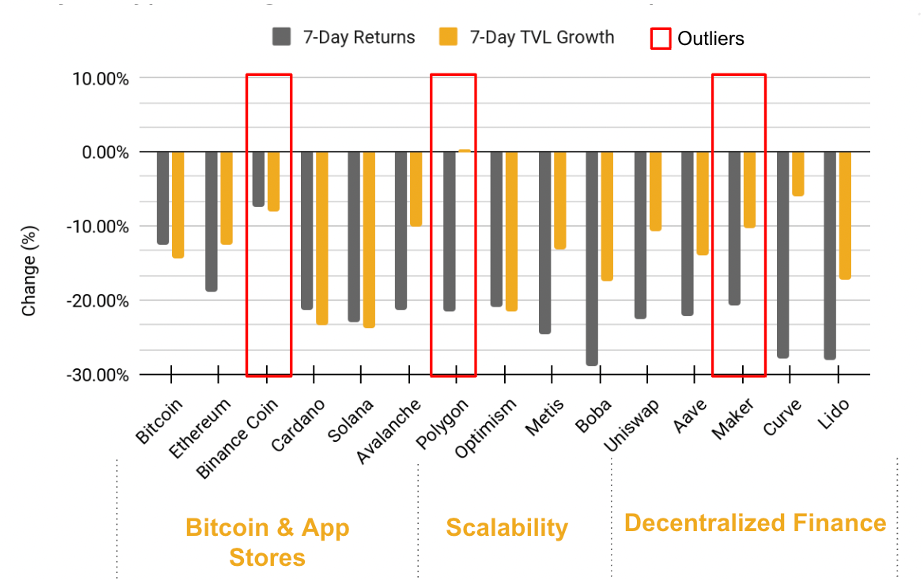
Source: 21Shares, Coingecko, DeFi Llama
Key takeaways
• Millions in long liquidation may be the main contributor to a market correction.
• Ethermine, the largest ETH mining pool, will not support PoW forks.
• Blue chip protocols continue siding exclusively with ETHPOS.
• Hundreds of NFTs face potential liquidations on BendDAO.
Spot and Derivatives Markets
Figure 2: Total Liquidations of Long and Short Positions
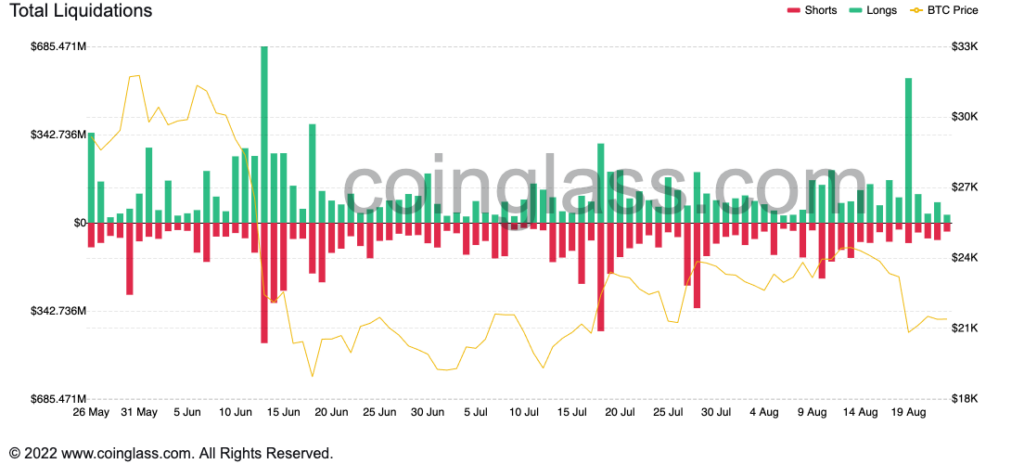
Source: Glassnode
The general downtrend of the crypto market may have been escalated by a liquidation spree that happened on Friday. According to data gathered by Coinglass, over 157K traders got liquidated on Friday, resulting in total liquidations of over $600M; Bitcoin traders lost over $239M, while Ethereum lost over $224M. With around $562M worth of long positions and $79M in shorts, this marks the biggest liquidation of long positions on futures since June 13, a few days before Bitcoin’s price fell below $20K.
On-chain Indicators
Figure 3: NVT Ratio of Bitcoin (2011-2022)
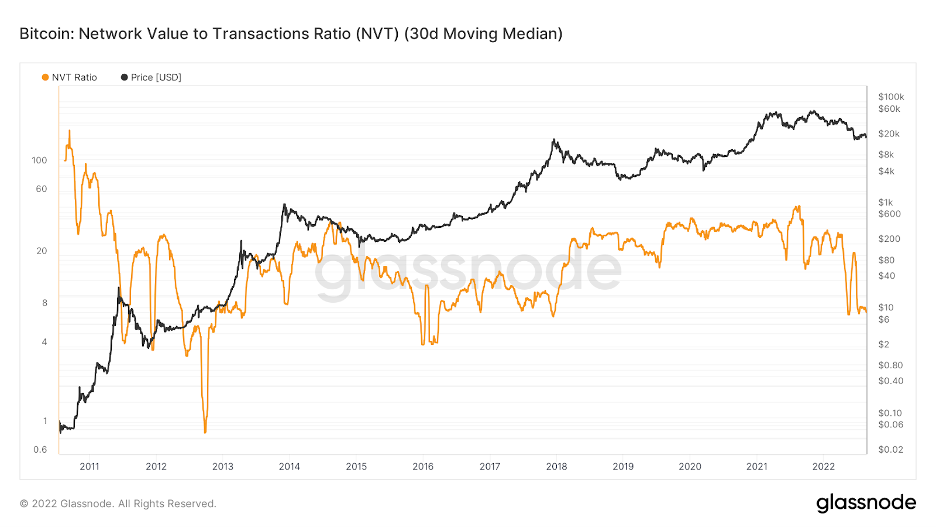
Source: Glassnode
With traders failing to meet margin requirements leading to enormous liquidations, one on-chain indicator that can help track the realized valuation levels of an asset is the Net Value to Transactions Ratio (NVT), analogous to the price to earnings for stocks. As shown in Figure 3, an NVT ratio as high as 100 indicates that the price of Bitcoin is overvalued, whereas downtrends like the one seen on July 24 indicate that investors are buying Bitcoin at a discount. Back in December 2018 when Bitcoin’s price fell to $3K, the NVT ratio fluctuated between 13 and 33. Compared to its current NVT ratio resting at 4.5 as of Monday, Bitcoin appears to be undervalued.
Figure 4: NVT Ratio of Ethereum (2011-2022)
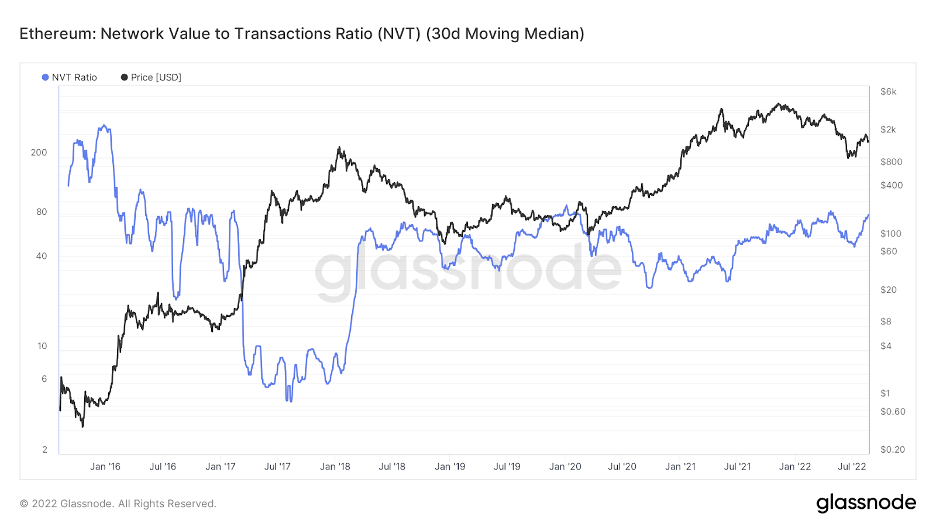
Source: Glassnode
When Ethereum’s price fell to $85 on December 16, 2018, the NVT ratio was 58.57. Compared to its current NVT ratio resting at 102.76 as of Monday, Ethereum may seem to be overvalued compared to historical levels.
Next Week’s Calendar
The two distinctive events of this week will be led by the release of the US GDP data on Thursday. The intelligence should denote the damage done to the US economy as a result of inflation. What’s more critical is the Core PCE price index, which is Fed’s favorite metric in understanding whether inflation has truly peaked or not, and which will be released on Friday.
Research Newsletter
Each week the 21Shares Research team will publish our data-driven insights into the crypto asset world through this newsletter. Please direct any comments, questions, and words of feedback to research@21shares.com
Disclaimer
The information provided does not constitute a prospectus or other offering material and does not contain or constitute an offer to sell or a solicitation of any offer to buy securities in any jurisdiction. Some of the information published herein may contain forward-looking statements. Readers are cautioned that any such forward-looking statements are not guarantees of future performance and involve risks and uncertainties and that actual results may differ materially from those in the forward-looking statements as a result of various factors. The information contained herein may not be considered as economic, legal, tax or other advice and users are cautioned to base investment decisions or other decisions solely on the content hereof.


President Trump announced a highly aggressive tariff package—one with broad macroeconomic implications—and global markets reacted sharply. In this environment of heightened volatility, we urge investors to maintain perspective, just as they should when prices are volatile to the upside (e.g., last year’s post-election rally).
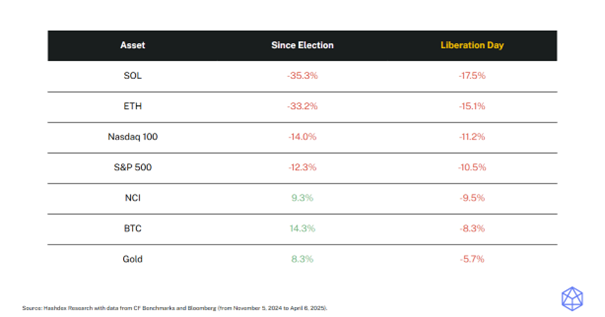
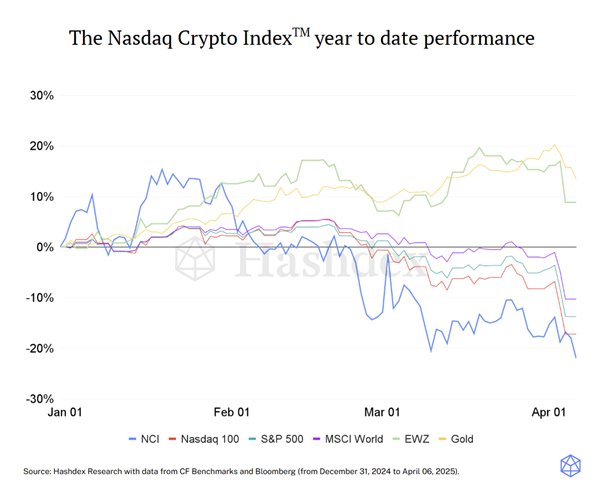
Notably, since the election, bitcoin and the Nasdaq Crypto Index have outperformed gold, the S&P 500, and Nasdaq 100. Even in the wake of the tariffs, only gold has outpaced bitcoin and the NCI—highlighting the relative strength of digital assets amid global market declines.
Market Highlights
Stablecoin legislation advances in US
The House Financial Services Committee voted to advance a monumental bill to regulate stablecoins, the STABLE Act, following the Senate Banking Committee approval of similar legislation earlier this year.
President Trump has said he wants stablecoin legislation approved by Congress before its August recess, reinforcing the new administration’s focus on establishing clear crypto regulation.
Tokenized fund sets dividend benchmark
BlackRock’s BUIDL paid an estimated $4.17 million in monthly dividends during March.
This highlights the potential of crypto to create attractive investment instruments, such as tokenized funds, which stood out this month paying massive dividends and setting a new benchmark for the class.
SEC chair orders review of crypto guidance
Acting SEC Chair Mark T. Uyeda ordered a review of past staff guidance on crypto, including risk warnings and interpretations of the Howey test.
This move, like others before, signals a broader shift toward a more open regulatory approach, potentially strengthening the presence of bitcoin and other digital assets in the US in the near future.
Market Metrics
The NCITM constituents had another negative week, with only XRP (-7.0%) and BTC (-3.8%) avoiding double-digit losses. The overall NCITM decline of -5.2% was cushioned by BTC’s relative resilience, as it performed better as a store-of-value asset. However, the drop still reflects a broader risk-off sentiment across all markets, driven by Trump’s tariff policies and growing macroeconomic uncertainties that are prompting investors to reassess their positions.
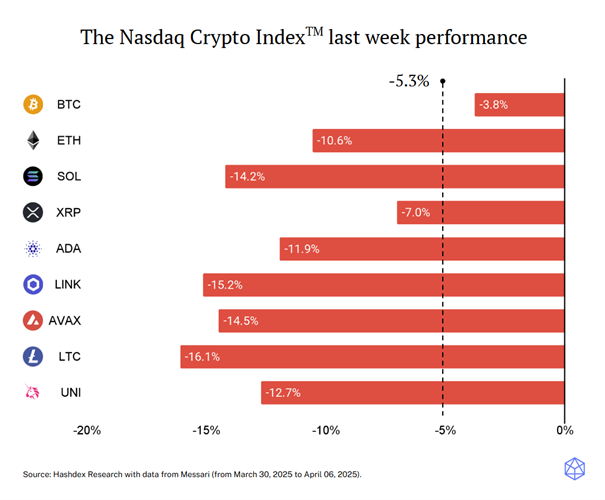
This week, the NCITM fell -5.3%, narrowing the gap with traditional indices such as the Nasdaq 100 (-9.8%) and S&P 500 (-9.1%) which experienced sharper losses following Trump’s tariff announcements. BTC (-3.8%) performed similarly to gold (-3.3%), though gold remains the top-performing asset class year-to-date. The week reinforced the risk-off sentiment, with investors broadly retreating from risk assets. Still, it also highlighted crypto’s growing relevance, as the most volatile asset class managed to outperform traditional markets in a stressed environment.


WEL8 ETF är en satsning på globala finansföretag

Tariffs spark turmoil: BTC holds its ground

JMES ETF en aktivt förvaltad fond från JPMorgan

Världens första europeiska försvars-ETF från ett europeiskt ETF-företag lanseras på Xetra och Euronext Paris

BSE7 ETF investerar i företagsobligationer med förfall 2027

Fonder som ger exponering mot försvarsindustrin

WisdomTree lanserar europeisk försvarsfond.

Warren Buffetts råd om vad man ska göra när börsen kraschar

De bästa börshandlade fonderna för tyska utdelningsaktier

Trumps återkomst får europeiska aktier att rusa
-
 Nyheter2 veckor sedan
Fonder som ger exponering mot försvarsindustrin
-
 Nyheter4 veckor sedan
WisdomTree lanserar europeisk försvarsfond.
-
 Nyheter2 veckor sedan
Warren Buffetts råd om vad man ska göra när börsen kraschar
-
 Nyheter3 veckor sedan
De bästa börshandlade fonderna för tyska utdelningsaktier
-
 Nyheter4 veckor sedan
Trumps återkomst får europeiska aktier att rusa
-

 Nyheter1 vecka sedan
Svenskarna har en ny favorit-ETF
-

 Nyheter1 vecka sedan
Crypto Market Risks & Opportunities: Insights on Bybit Hack, Bitcoin, and Institutional Adoption
-

 Nyheter3 veckor sedan
HANetf lanserar Europa-fokuserad försvars-ETF