
Nyheter
ETC Group Crypto Market Compass #7 2024
• Bitcoin closes at highest price since December 2021 as cryptoassets recover strongly on the back of positive net inflows into US spot Bitcoin ETFs and rising futures open interest
• Our in-house “Cryptoasset Sentiment Index” has also recovered strongly and signals bullish sentiment
• Global Bitcoin ETP flows top +1 bn USD last week as monthly flows into top 2 US products were best in US ETF history
Chart of the Week
Performance
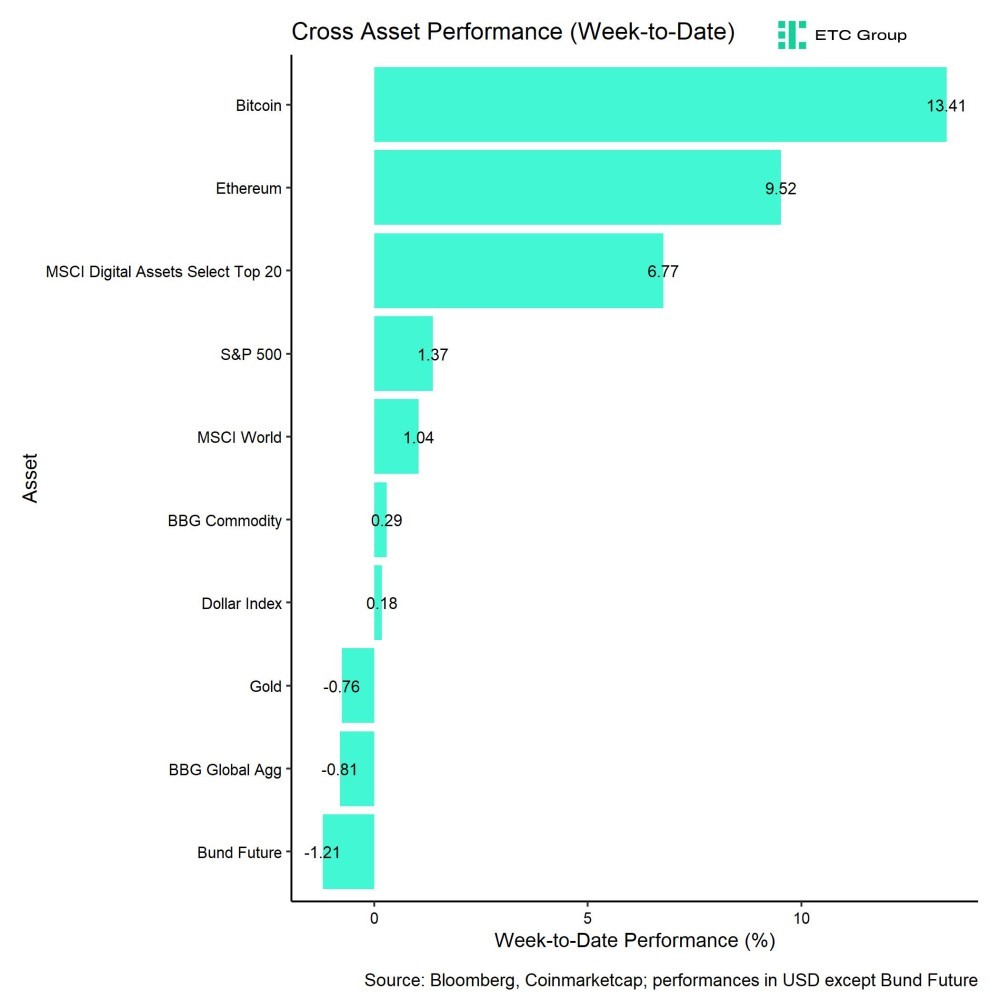
Last week, cryptoassets continued to recover strongly on the back of positive net inflows into US spot Bitcoin ETFs and rising futures open interest.
More specifically, global cryptoasset ETP fund flows topped +1 bn USD last week which was the highest weekly net inflow since the first week of trading of the US spot Bitcoin ETFs in early January.
One month after the launch of the US spot Bitcoin ETFs, the top 2 US products have recorded the most flows in the history of US ETF trading launches which demonstrates that the launch has been a huge success so far.
Meanwhile, BTC futures open interest also picked up significantly in a sign that global risk appetite is returning. In fact, our in-house Cryptoasset Sentiment Index has also recovered briskly to levels last seen before the recent “sell-the-news” correction which is consistent with an overall return in cross asset risk appetite.
Meanwhile, a recent institutional trader survey by JP Morgan implies that overall interest in cryptoassets is still rather lukewarm. In a poll of more than 4,000 traders conducted by the bank, 78% of respondents said they would not trade cryptocurrencies, and only 12% said they would do so over the next five years.
Besides, Google Trends search queries for “bitcoin” in the US also remain well below previous cycle peaks of 2021 or 2017 which implies that retail sentiment is also still muted which is overall a positive sign amid increasing risk appetite.
It seems as if the market is turning a blind eye on unpleasant macro developments that are happening in the background such as increasing risks in the global financial system and as such increasing recession risks.
For instance, last week the German lender Deutsche Pfandbriefbank came into crosshairs as it significantly increased its loan loss provisions related to its US commercial real estate exposure. This is following similar developments in the US (New York Community Bank) and in Japan (Aozora Bank) more recently.
That being said, in particular Bitcoin could be regarded as a hedge against rising systemic risks in the banking system as a censorship-resistant and counterparty risk-free asset.
One of the reasons why markets are turning a blind eye is the Chinese New Year celebrations that were accompanied by increasing monetary stimuli by the People’s Bank of China. In fact, aggregate financing in China, which comprises of bank loans and non-bank financing activity in China, has reached an all-time high in January 2024.
Although it is quite common to see a seasonal pick-up in lending activity in China during the annual new year festivities around January/February, the fact that it has reached an all-time high is yet another piece of evidence that the Chinese authorities are clearly trying to support the economy. Lending activity in China usually leads real economic activity by approximately half a year which implies improving economic conditions over the coming months.
What is more is that, based on our own calculations, improvements in global growth expectations have been the major macro factor for Bitcoin’s performance over the past 6 months. So, since China is the global business cycle behemoth, any further positive news from China should also affect Bitcoin and cryptoassets positively.
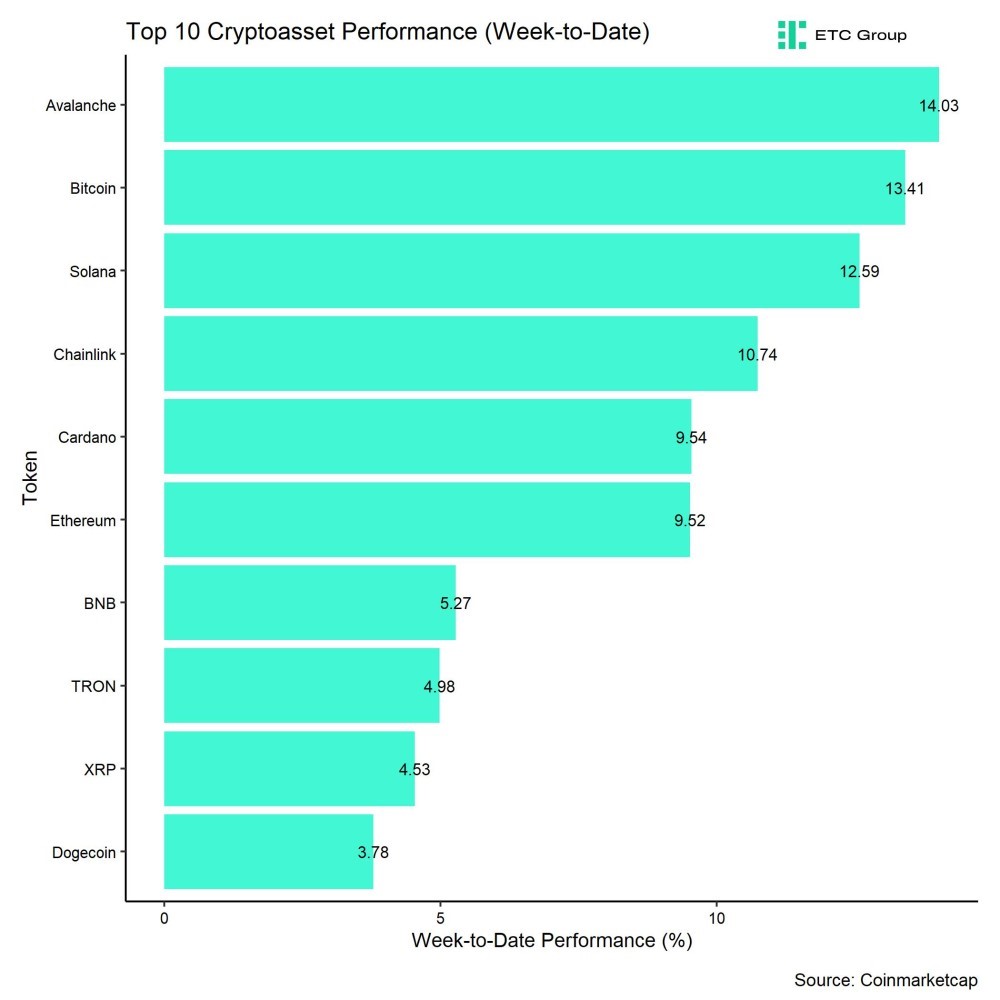
In general, among the top 10 crypto assets, Avalanche, Bitcoin, and Solana were the relative outperformers.
Solana outperformed somewhat counter-intuitively despite an outage that happened last week due to a fixed but not yet implemented bug fix.
However, altcoin outperformance vis-à-vis Bitcoin was relatively weak, with only 10% of our tracked altcoins managing to outperform Bitcoin on a weekly basis.
Sentiment
Our in-house “Cryptoasset Sentiment Index” has also recovered strongly and signals bullish sentiment.
At the moment, 9 out of 15 indicators are above their short-term trend.
Compared to last week, we saw major reversals to the upside in global crypto ETP fund flows and the BTC futures long liquidation dominance.
The Crypto Fear & Greed Index remains in ”Greed” territory as of this morning.
Meanwhile, our own measure of Cross Asset Risk Appetite (CARA) has continued to increase as well which is signalling a positive sentiment in traditional financial markets.
Besides, performance dispersion among cryptoassets has declined somewhat but still remained relatively high.
In general, high performance dispersion among cryptoassets implies that correlations among cryptoassets are low, which means that cryptoassets are trading more on coin-specific factors.
At the same time, altcoin outperformance vis-à-vis Bitcoin was still relatively low, with an underperformance of Ethereum vis-à-vis Bitcoin last week. Viewed more broadly, only 10% of our tracked altcoins have outperformed Bitcoin on a weekly basis.
In general, low altcoin outperformance tends to be a sign of low risk appetite within cryptoasset markets.
Fund Flows
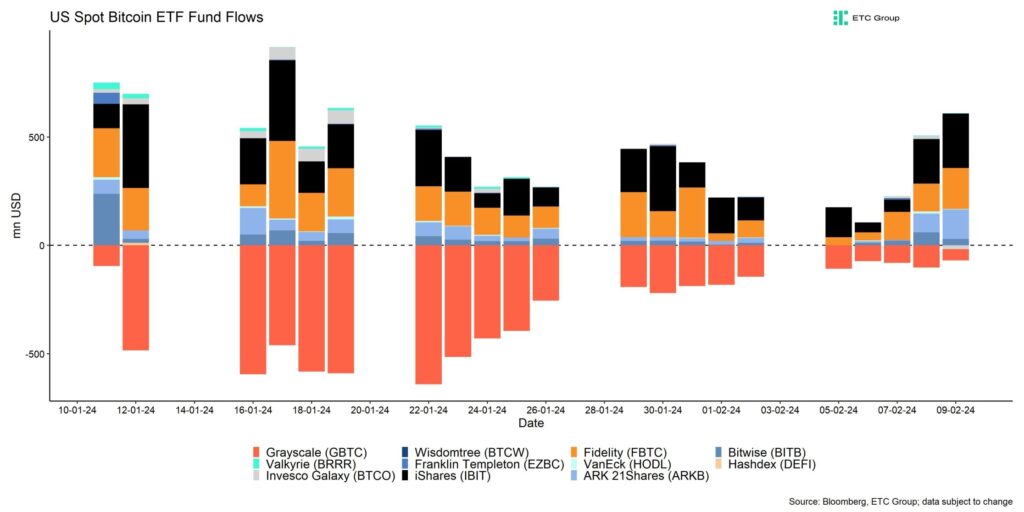
Overall, we saw net fund inflows in the amount of +1091.9 mn USD (week ending Friday) based on Bloomberg data across all types of cryptoassets.
Global Bitcoin ETPs continued to see significant net inflows of +1079.5 mn USD of which +1194.4 mn (net) were related to US spot Bitcoin ETFs alone.
The Grayscale Bitcoin Trust (GBTC) continued to see net outflows of around -415 mn USD last week albeit at a decelerating pace. This was more than offset by net inflows into other US spot Bitcoin ETFs. For instance, BlackRock’s iShares Bitcoin Trust (IBIT) took in +684 mn USD and Fidelity’s Bitcoin ETF (FBTC) took in +523 mn USD last week.
Both IBIT and FBTC have recorded the most flows in the history of US ETF trading launches one month after trading launch which demonstrates that the launch has been a huge success so far.
Note that some fund flows data for US major issuers are still lacking in the abovementioned numbers due to T+2 settlement.
Apart from Bitcoin, we saw comparatively small flows into other cryptoassets last week.
There were some minor inflows into global Ethereum ETPs of around +6.7 mn USD. Altcoin ETPs ex Ethereum that managed to attract +17.2 mn USD last week.
In contrast, thematic & basket crypto ETPs experienced net outflows of -11.4 mn USD, based on our calculations.
Besides, the beta of global crypto hedge funds to Bitcoin over the last 20 trading still implies that global crypto hedge funds remain under-exposed to Bitcoin market risks.
On-Chain Data
Positive on-chain developments have also supported the recent recovery. For instance, BTC exchange balances have reversed last week and reached their lowest level since July 2018. ETH exchange balances have also continued to drift lower.
All in all, BTC net exchange transfers and deposits have recently been negative and BTC exchange balances have declined over the past week as a result. This implies overall increasing demand for Bitcoin.
Most of those net outflows occurred from wallet sizes in excess of 1 mn USD which implies that the majority of net outflows from exchanges and thus net demand originates from larger (institutional) investors.
At the same time, whale deposits to exchanges have clearly levelled off last week in a sign of decreasing selling pressure from large entities. Whales are defined as network entities (cluster of addresses) that hold at least 1,000 BTC. Long-term holders have also reduced their transfers to exchanges significantly over the past 2 weeks and long-term holder supply has stabilized somewhat.
Meanwhile, BTC miners continue selling into their reserves as BTC miner balances have reached their lowest level since July 2021. It seems as if BTC miners are trying to prop up their cash reserves ahead of the Halving which is less than 10000 blocks away and expected to happen around the 20th of April.
The overall BTC network hash rate continues to hover near the all-time high reached on the 2nd of February and total miner revenues have declined towards the block subsidy as transaction demand has somewhat normalized.
Futures, Options & Perpetuals
BTC futures open interest has increased significantly last week with an increase of around +32k BTC of which CME accounted for around +20.7k BTC. Perpetual open interest also increased by around +12k BTC last week.
As a result, the 3-months annualized BTC futures also increased to around 11.0% p.a. and the BTC perpetual funding rate increased to the highest level since January 12th across major derivatives exchanges.
BTC options’ open interest also increased significantly last week by around +26k BTC. Interestingly enough, the Put-call open interest increased throughout the week implying that option traders built up downside protections throughout the week as well. Put-call volume ratios also increased which is consistent with this observation.
However, the 25-delta BTC option skew for all major expiries has declined significantly over the past week in favour of call options, implying renewed interest for upside calls. At the same time, there was a reversal in implied volatilities to the upside, especially in earlier expiries.
Bottom Line
• Bitcoin closes at highest price since December 2021 as cryptoassets recover strongly on the back of positive net inflows into US spot Bitcoin ETFs and rising futures open interest
• Our in-house “Cryptoasset Sentiment Index” has also recovered strongly and signals bullish sentiment
• Global Bitcoin ETP flows top +1 bn USD last week as monthly flows into top 2 US products were best in US ETF history
Disclaimer
Important Information
The information provided in this material is for informative purposes only and does not constitute investment advice, a recommendation or solicitation to conclude a transaction. This document (which may be in the form of a blogpost, research article, marketing brochure, press release, social media post, blog post, broadcast communication or similar instrument – we refer to this category of communications generally as a “document” for purposes of this disclaimer) is issued by ETC Issuance GmbH (the “issuer”), a limited company incorporated under the laws of Germany, having its corporate domicile in Germany. This document has been prepared in accordance with applicable laws and regulations (including those relating to financial promotions). If you are considering investing in any securities issued by ETC Group, including any securities described in this document, you should check with your broker or bank that securities issued by ETC Group are available in your jurisdiction and suitable for your investment profile.
Exchange-traded commodities/cryptocurrencies, or ETPs, are a highly volatile asset and performance is unpredictable. Past performance is not a reliable indicator of future performance. The market price of ETPs will vary and they do not offer a fixed income. The value of any investment in ETPs may be affected by exchange rate and underlying price movements. This document may contain forward-looking statements including statements regarding ETC Group’s belief or current expectations with regards to the performance of certain asset classes. Forward-looking statements are subject to certain risks, uncertainties and assumptions, and there can be no assurance that such statements will be accurate and actual results could differ materially. Therefore, you must not place undue reliance on forward-looking statements. This document does not constitute investment advice nor an offer for sale nor a solicitation of an offer to buy any product or make any investment. An investment in an ETC that is linked to cryptocurrency, such as those offered by ETC Group, is dependent on the performance of the underlying cryptocurrency, less costs, but it is not expected to match that performance precisely. ETPs involve numerous risks including, among others, general market risks relating to underlying adverse price movements and currency, liquidity, operational, legal, and regulatory risks.
For more details and the full disclaimer


SAWG ETF är en globalfond valutasäkrad i GBP

Europeisk försvars-ETF når 10 miljoner dollar under den första noteringsveckan

Hur investerar jag i ETFer som fokuserar på breda vallgravar?

WELL ETF för den som tror på den globala IT-sektorn

Dogecoin, the meme that made it

Fonder som ger exponering mot försvarsindustrin
Crypto Market Risks & Opportunities: Insights on Bybit Hack, Bitcoin, and Institutional Adoption

Montrose storsatsning på ETFer fortsätter – lanserar Sveriges första globala ETF med hävstång

Warren Buffetts råd om vad man ska göra när börsen kraschar

Svenskarna har en ny favorit-ETF
-
 Nyheter4 veckor sedan
Fonder som ger exponering mot försvarsindustrin
-

 Nyheter3 veckor sedan
Crypto Market Risks & Opportunities: Insights on Bybit Hack, Bitcoin, and Institutional Adoption
-
 Nyheter2 veckor sedan
Montrose storsatsning på ETFer fortsätter – lanserar Sveriges första globala ETF med hävstång
-
 Nyheter4 veckor sedan
Warren Buffetts råd om vad man ska göra när börsen kraschar
-
 Nyheter3 veckor sedan
Svenskarna har en ny favorit-ETF
-

 Nyheter2 veckor sedan
MONTLEV, Sveriges första globala ETF med hävstång
-

 Nyheter4 veckor sedan
Fastställd utdelning i MONTDIV mars 2025
-

 Nyheter2 veckor sedan
Sju börshandlade fonder som investerar i försvarssektorn