
Nyheter
ETC Group Crypto Market Compass #11 2024
• Cryptoassets reach new all-time highs supported by ongoing high net inflows into US Bitcoin ETFs
• Our in-house “Cryptoasset Sentiment Indicator” has come off its highs but still signals bullish sentiment
• Prices continue to be supported by a pervasive demand overhang / supply deficit on Bitcoin spot exchanges which amounted to around 1.4 bn USD over the past week
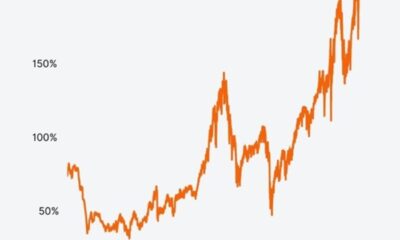
Chart of the Week
Performance
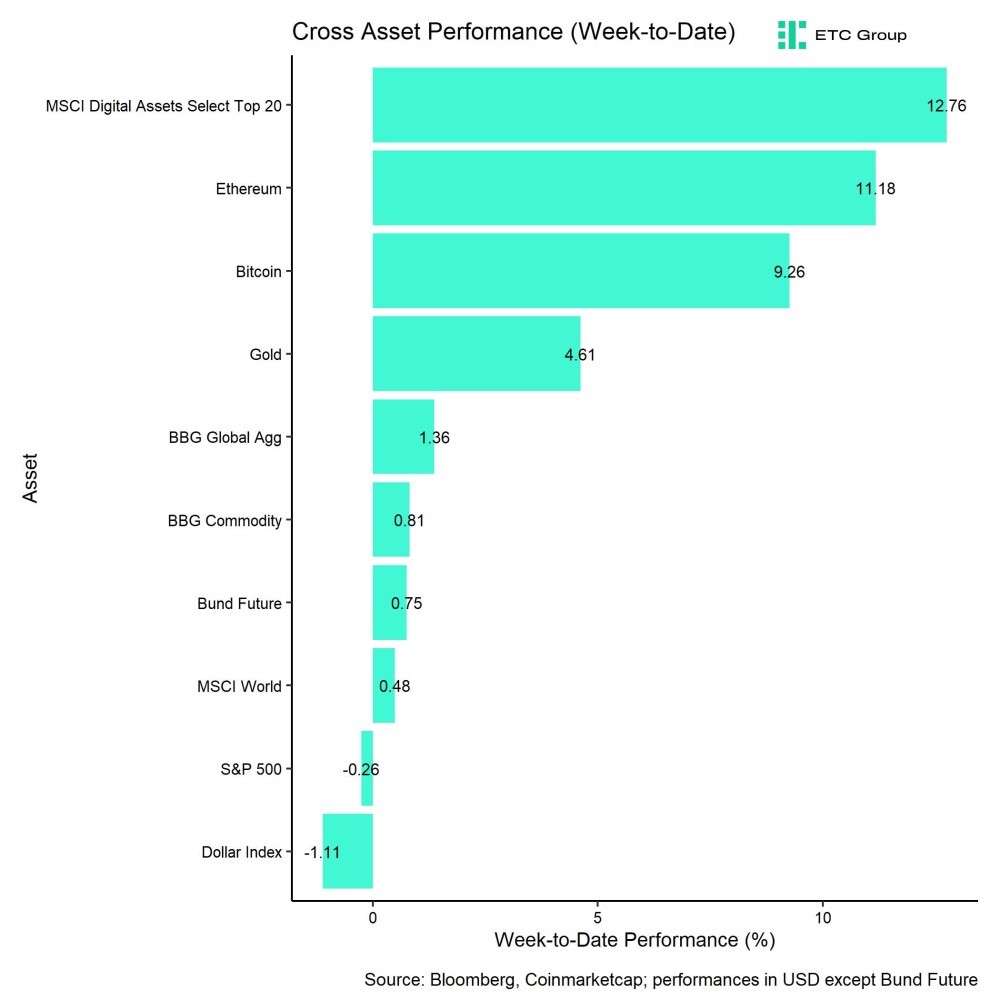
Last week, cryptoassets posted another week of strong performance supported by ongoing high net inflows into US Bitcoin ETFs.
US spot Bitcoin ETFs saw another week of above +2 bn USD in net inflows. Despite the fact that we saw very significant profit-taking by short-term BTC holders, i.e. those with a holding period of less than 155 days, this supply distribution was absorbed by much larger demand.
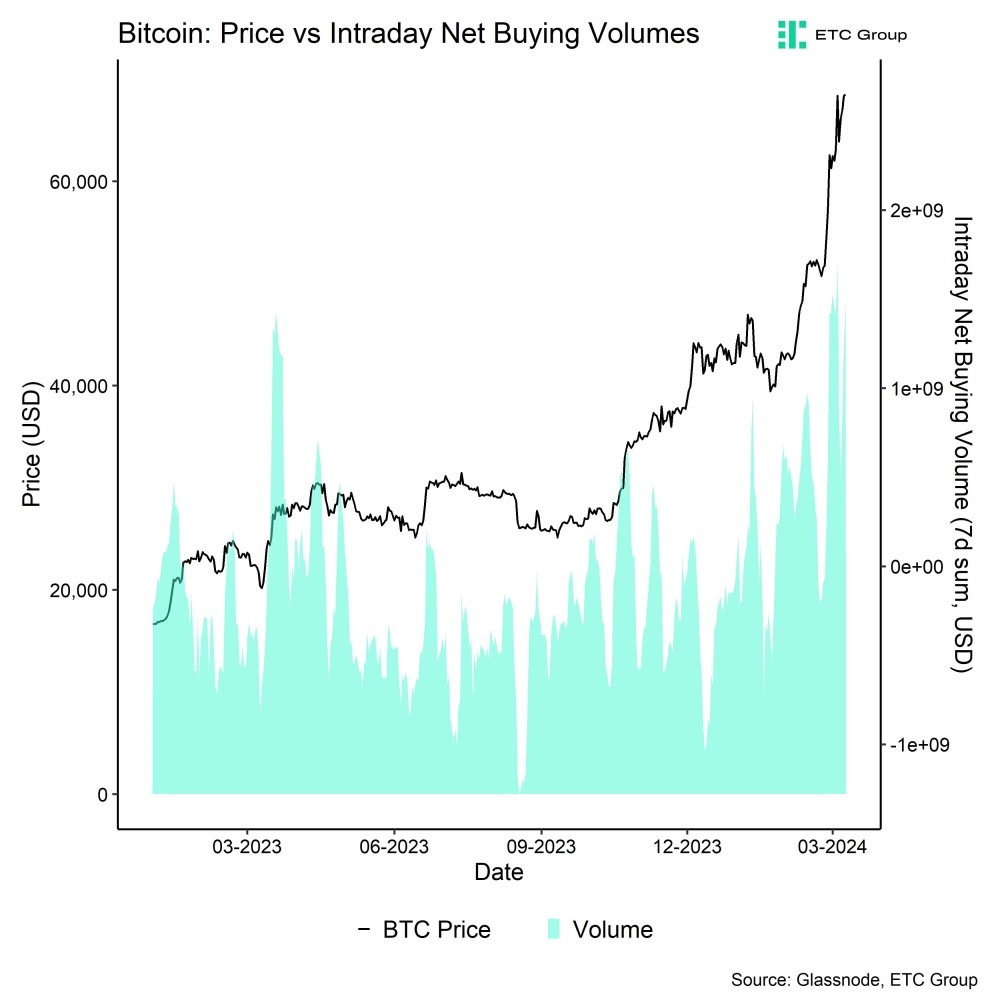
Prices generally continue to be supported by a pervasive demand overhang / supply deficit on Bitcoin spot exchanges which amounted to around 1.4 bn USD over the past week (Chart-of-the-Week).
We expect this significant demand overhang induced by significant ETF inflows to continue at least over the next 3 months as the majority of ETF fund inflows is still yet to come based on our initial estimation of more than 30 bn USD of eligible capital that could flow into US spot Bitcoin ETFs over the medium term (see ETC Group Outlook 2024 report).
Moreover, the total amount of eligible flows has likely increased in nominal terms as traditional financial markets have also been rallying since we made that estimation.
That being said, overall sentiment still remains bullish which makes short-term pullbacks still very likely. This observation is also supported by the recent increase in the so-called “Kimchi Premium” which measures the price premium of bitcoins traded on Korean exchanges relative to Coinbase. This premium recently surged above 10% implying increasing euphoria among retail investors as the Korean exchanges are particularly dominated by retail investors.
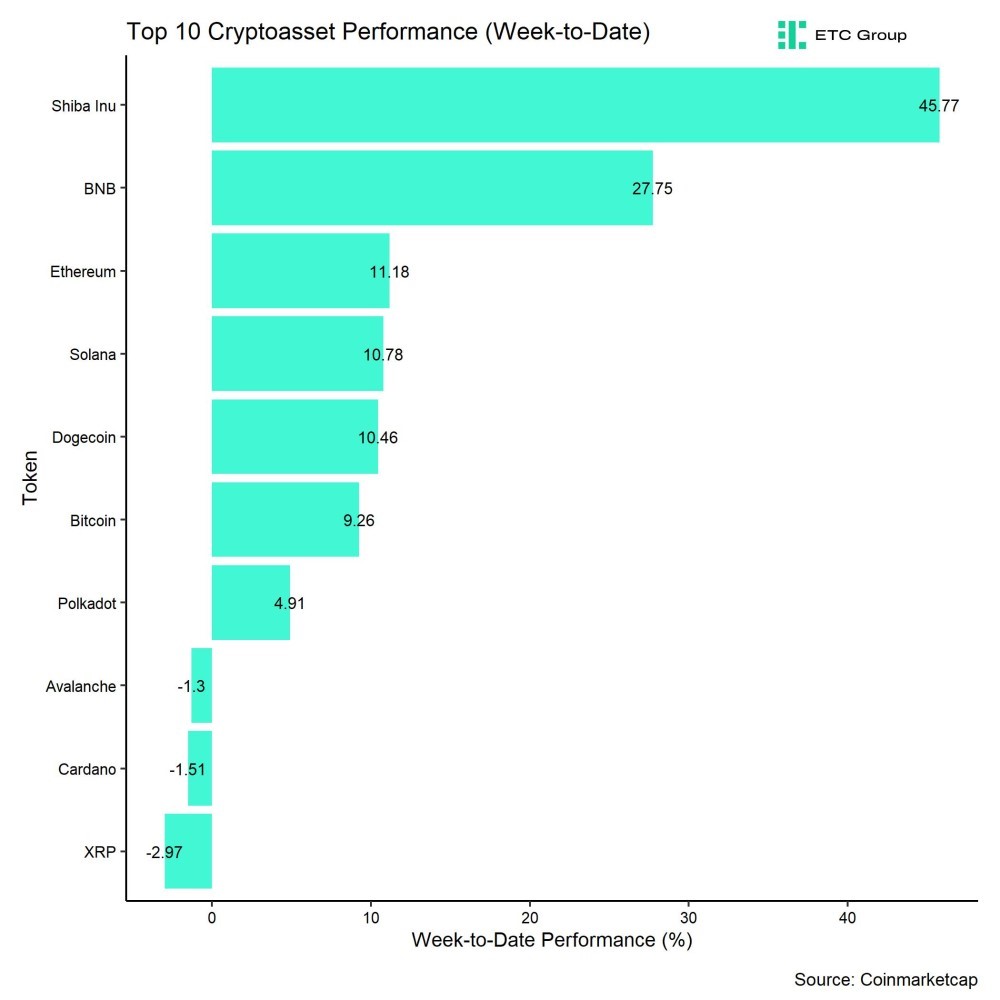
In general, among the top 10 crypto assets, Shiba Inu, BNB, and Ethereum were the relative outperformers.
Nonetheless, overall altcoin outperformance vis-à-vis Bitcoin declined somewhat compared to the week prior, with only 30% of our tracked altcoins managing to outperform Bitcoin on a weekly basis.
Sentiment
Our in-house “Cryptoasset Sentiment Index” has come off its highs but still signals bullish sentiment.
At the moment, 11 out of 15 indicators are above their short-term trend.
There were significant increases in BTC futures basis rate and the short-term holder net unrealized profit/loss ratio (STH-NUPL).
The Crypto Fear & Greed Index still remains in ”Extreme Greed” territory as of this morning.
Meanwhile, our own measure of Cross Asset Risk Appetite (CARA) declined somewhat throughout the week which signals less bullish sentiment in traditional financial markets.
Performance dispersion among cryptoassets has declined significantly albeit from the highest readings ever recorded in our sample. Performance dispersion still remains relatively high.
In general, high performance dispersion among cryptoassets implies that correlations among cryptoassets are low, which means that cryptoassets are trading more on coin-specific factors and that cryptoassets are increasingly decoupling from the performance of Bitcoin.
At the same time, altcoin outperformance vis-à-vis Bitcoin declined somewhat, despite a slight outperformance of Ethereum vis-à-vis Bitcoin last week. Viewed more broadly, around 30% of our tracked altcoins have outperformed Bitcoin on a weekly basis.
In general, decreasing altcoin outperformance tends to be a sign of declining risk appetite within cryptoasset markets.
Fund Flows
Overall, we saw another week of record net fund inflows in the amount of +2,754.6 mn USD (week ending Friday) based on Bloomberg data across all types of cryptoassets.
Global Bitcoin ETPs continued to see significant net inflows of +2,702.2 mn USD of which +2,238.7 mn (net) were related to US spot Bitcoin ETFs alone. The ETC Group Physical Bitcoin ETP (BTCE) saw net outflows equivalent to -75.5 mn USD last week.
The Grayscale Bitcoin Trust (GBTC) experienced a significant increase in net outflows of around -1,654.4 mn USD last week. However, this was also more than offset by net inflows into other US spot Bitcoin ETFs which managed to attract +3,893.1 bn USD (ex GBTC).
Note that some fund flows data for US major issuers are still lacking in the abovementioned numbers due to T+2 settlement.
Apart from Bitcoin, we saw comparatively small flows into other cryptoassets last week again.
Global Ethereum ETPs saw net outflows last week of around -12.8 mn USD after a week of significant inflows. However, the ETC Group Physical Ethereum ETP (ZETH) managed to attract +0.25 mn USD.
Besides, Altcoin ETPs ex Ethereum managed to attract significant inflows of around +49.9 mn USD last week.
Thematic & basket crypto ETPs also experienced net inflows of +15.2 mn USD, based on our calculations. The ETC Group MSCI Digital Assets Select 20 ETP (DA20) also saw net inflows of around +0.46 mn USD last week.
Besides, the beta of global crypto hedge funds to Bitcoin over the last 20 trading has decreased significantly to around 1.04 which implies that global crypto hedge funds have significantly decreased their market exposure recently.
On-Chain Data
Overall, cryptoasset prices continue to be supported by a significant imbalance between supply and demand for bitcoins on spot exchanges. The current global Bitcoin ETP inflows and US ETF inflows in particular are generally the main driver of this imbalance that provide a significant support for prices.
More specifically, prices generally continue to be supported by a pervasive demand overhang / supply deficit on Bitcoin spot exchanges which amounted to around 1.4 bn USD over the past week (Chart-of-the-Week). This is also corroborated by similar numbers in the cumulative volume delta (CVD) over the past.
In this context, we are also observing ongoing exchange withdrawals of bitcoins which amounted to around -481 mn USD over the past week according to data provided by Glassnode.
What is more is that so-called whales have continued to withdraw bitcoins from exchanges every single since mid-January. Whales are defined as network entities (cluster of addresses) that hold at least 1,000 BTC. As a result, bitcoin exchange balances have continued to drift lower and remain near their 6-year lows.
Meanwhile, short-term BTC holders have continued to send significant amounts of bitcoins to exchanges in a sign of increased profit-taking. Wednesday saw the highest USD-amount of short-term holder transfers of bitcoins in profit to exchanges ever of around 4.3 bn USD. Bitcoin miners also continue to send significant amounts of bitcoins to exchanges. Over the past 30 days, Bitcoin miners have sold around 121% of mined supply, i.e. have sold around 1/5 more than they mine per day.
Futures, Options & Perpetuals
The recent surge in prices was also supported by increased open interest in cryptoasset derivatives.
For instance, BTC futures open interest increased by around +29k BTC while BTC perpetual open interest increased by around +8k BTC over the past week.
Meanwhile, the volume of futures short liquidations continued to decline implying that short open interest was significantly reduced while long liquidations spiked on the 5th of March last week when heightened intraday volatility caught long traders off guard. Both the volume of long and short liquidations have declined considerably since then.
Besides, the 3-months annualized BTC futures reached a new cycle high to around 23.5% p.a. which is the highest reading since May 2021.
BTC perpetual funding rates have come off their cycle highs but remained positive throughout the week.
BTC options’ open interest also increased last week by around +38k BTC as traders shifted towards buying more call options. The Put-call open interest declined compared to last week and is now at around 0.57. Put-call volume ratios also declined indicating less appetite for downside protection and more appetite for upside calls, respectively.
The 25-delta BTC option skew also continued to decline consistent with less appetite for puts.
However, BTC option implied volatilities continued to drift higher throughout the week with fresh year-to-date highs of around 78.0% p.a. for 1-month ATM options – the highest reading since November 2022.
Bottom Line
• Cryptoassets reach new all-time highs supported by ongoing high net inflows into US Bitcoin ETFs
•
Our in-house “Cryptoasset Sentiment Indicator” has come off its highs but still signals bullish sentiment
• Prices continue to be supported by a pervasive demand overhang / supply deficit on Bitcoin spot exchanges which amounted to around 1.4 bn USD over the past week
Disclaimer
Important Information
The information provided in this material is for informative purposes only and does not constitute investment advice, a recommendation or solicitation to conclude a transaction. This document (which may be in the form of a blogpost, research article, marketing brochure, press release, social media post, blog post, broadcast communication or similar instrument – we refer to this category of communications generally as a “document” for purposes of this disclaimer) is issued by ETC Issuance GmbH (the “issuer”), a limited company incorporated under the laws of Germany, having its corporate domicile in Germany. This document has been prepared in accordance with applicable laws and regulations (including those relating to financial promotions). If you are considering investing in any securities issued by ETC Group, including any securities described in this document, you should check with your broker or bank that securities issued by ETC Group are available in your jurisdiction and suitable for your investment profile.
Exchange-traded commodities/cryptocurrencies, or ETPs, are a highly volatile asset and performance is unpredictable. Past performance is not a reliable indicator of future performance. The market price of ETPs will vary and they do not offer a fixed income. The value of any investment in ETPs may be affected by exchange rate and underlying price movements. This document may contain forward-looking statements including statements regarding ETC Group’s belief or current expectations with regards to the performance of certain asset classes. Forward-looking statements are subject to certain risks, uncertainties and assumptions, and there can be no assurance that such statements will be accurate and actual results could differ materially. Therefore, you must not place undue reliance on forward-looking statements. This document does not constitute investment advice nor an offer for sale nor a solicitation of an offer to buy any product or make any investment. An investment in an ETC that is linked to cryptocurrency, such as those offered by ETC Group, is dependent on the performance of the underlying cryptocurrency, less costs, but it is not expected to match that performance precisely. ETPs involve numerous risks including, among others, general market risks relating to underlying adverse price movements and currency, liquidity, operational, legal, and regulatory risks.


HANetf lanserar Middlefield Canadian Enhanced Income UCITS ETF vilket ger europeiska investerare tillgångar inom aktivt förvaltad kanadensisk utdelning

GinsGlobal Tech Megatrend ETF lägger till kvantberäknings- och försvarsteknik mitt i global innovationsboom

JESE ETF investerar i Europa och filterar enligt ESG

HANetf säger att nytt index stärker 8RMY ETF:s ansvarsfulla attraktionskraft

ONVD ETP spårar NVIDIA och betalar utdelning varje månad

Fokus mot en helt ny börshandlad produkt i september 2025

M5TYs senaste utdelningstakt (55 %) belyser covered call-strategins inkomstpotential

Börshandlade fonder för europeiska small caps

Miners Find Their Mojo as Gold Consolidates
Levler noterar ytterligare fyra börshandlade fonder i Sverige
-
 Nyheter3 veckor sedan
Fokus mot en helt ny börshandlad produkt i september 2025
-
 Nyheter4 veckor sedan
M5TYs senaste utdelningstakt (55 %) belyser covered call-strategins inkomstpotential
-
 Nyheter4 veckor sedan
Börshandlade fonder för europeiska small caps
-
 Nyheter4 veckor sedan
Miners Find Their Mojo as Gold Consolidates
-

 Nyheter2 veckor sedan
Levler noterar ytterligare fyra börshandlade fonder i Sverige
-

 Nyheter4 veckor sedan
State Street och Blackstone lanserar aktivt förvaltade CLO-ETFer i Europa
-

 Nyheter4 veckor sedan
Kärnkraftsavtal mellan Storbritannien och USA väcker förhoppningar om uranboom
-
 Nyheter4 veckor sedan
Den amerikanska aktiemarknaden är den dyraste på över 50 år, enligt Buffett-indikatorn