
Nyheter
Equity all-time highs are meaningless

Equity all-time highs are meaningless. Today the Dow Jones and S&P 500 have both hit all-time historical highs, but we believe its a meaningless milestone, with the headlines only likely to feed further positive momentum.
Looking historically the Dow Jones Industrial index has regularly made new “all-time highs”, since the 1950s there have been 1161 all-time highs and so far this year there have been 7.

(click to enlarge)
Looking at all trading days since the beginning of 1950, a total of 6.7% of all trading days represent new all-time highs. In fact, if we were to interpret the data correctly it seems this we are achieving less all-time highs this decade than ever before, despite QE (quantitative easing) ramping up equity valuations.
The pattern of all-time highs really reflect periods after economic malaise, typically during these weaker points we see drought periods where no new all-time highs are achieved. For instance, from 2007 to 2013 there were 1973 days where no new all-time highs were achieved, then after this period we saw a whole flurry of them.

(click to enlarge)
In terms of the real experience for the investor, total return (including dividends) must be taken into consideration too. After the all-time highs achieved in 2007 in simple price terms investors had to wait until 2013 to achieve a new all-time high, but in total return terms this was 2 years earlier.
Equities, unlike bonds, are to some extent a real asset as companies tend to pass on rising costs to their consumers rather than allow margins to be squeezed, and therefore do tend to continue to rise over time.
Aside from being a psychological level, all-time highs are a bit like Denis Quaid’s view on golf, its meaningless but it means so much.
James Butterfill, Head of Research & Investment Strategy at ETF Securities
James Butterfill joined ETF Securities as Head of Research & Investment Strategy in 2015. James is responsible for leading the strategic direction of the global research team, ensuring that clients receive up-to-date, expert insight into global macroeconomic and asset class specific developments.
James has a wealth of experience in strategy, economics and asset allocation gained at HSBC and most recently in his role as Multi- Asset Fund Manager and Global Equity Strategist at Coutts. James holds a Bachelor of Engineering from the University of Exeter and an MSc in Geophysics from Keele University.


Stablecoins are digital currencies tied to assets like the U.S. dollar, offering the price stability needed for payments. They maintain their peg by being backed 1:1 by their underlying fiat currency, with issuers holding equivalent amounts in cash and cash equivalents, making stablecoins a digital representation of those reserves. Their market has doubled to over $235 billion, with daily usage nearly doubling in two years.
Why are stablecoins making headlines now?
Due to their clear product-market fit and growing mainstream adoption, stablecoins have become a top priority for regulation, with both industry leaders and policymakers calling for swift action.
On April 4, the Securities and Exchange Commission’s Division of Corporation Finance finally clarified that stablecoins are not securities if backed one-for-one by USD or similar assets and used for payments or value storage. These “Covered Stablecoins” are not marketed as investments, lack profit incentives, and include protections like reserves, making securities law registration unnecessary for issuance or redemption.
The GENIUS Act, introduced in February and advanced by the U.S. Senate Banking Committee in March, marks a major step toward creating a clear legal framework for stablecoin issuance and oversight. This clarity is driving momentum as Fidelity is set to launch its own stablecoin, and Bank of America is preparing to follow it once legislation is finalized.
Globally, the European Union’s Markets in Crypto Assets (MiCA) framework has already come into effect, reinforcing a broader shift toward formal integration of stablecoins into traditional finance. These developments reflect a growing consensus that stablecoins are emerging as essential infrastructure for global payments, treasury management, and digital asset adoption.
What are the benefits of stablecoins?
Stablecoins are digital currencies designed for fast, low-cost, and stable transactions. Since their launch in 2014, they’ve become a go-to tool for online payments, especially cross-border transfers. As they’re pegged to stable assets like the U.S. dollar or euro, they avoid the wild price swings seen in other cryptocurrencies.
They’re accessible to anyone with internet, making them especially valuable in regions with high inflation or limited banking access, like Argentina or Turkey.
With some built on public blockchains, stablecoins offer transparency, letting users track transfers and supply in real time. For institutions, they also simplify treasury management by acting as efficient digital cash that can be deployed instantly.
Who are the major players in the stablecoin race?
Tether (USDT) and Circle (USDC), the two largest stablecoin issuers, collectively hold over $204 billion in U.S. Treasuries, making them the 14th largest holders globally. Their combined treasury holdings surpass those of entire nations, including Norway and Brazil.
USDT leads with $144 billion in circulation; USDC, backed by Coinbase and known for compliance, has become a trusted digital dollar across global finance.
Why stablecoins matter: A revenue engine for blockchains
Stablecoins generate steady revenue for blockchains like Ethereum and Solana by driving transaction fees with each transfer. With trillions in annual volume, they help sustain network activity beyond speculation.
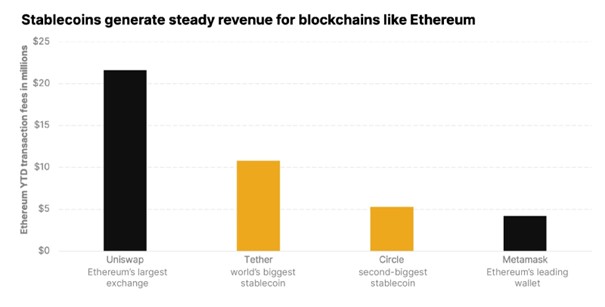
On Ethereum, for example, USDT and USDC transactions are major contributors to daily gas fees. Year to date, Tether ranks #3 and USDC ranks #5 in terms of total gas consumed. Tether and Circle also dominate daily transaction activity on Ethereum, averaging approximately 12 million and 6 million transactions per day, respectively, making them the top two entities on the network by daily transaction count.
Meanwhile, on Solana, stablecoin activity has surged, helping sustain validator rewards and strengthen protocol economics. In addition to the mainstream utility, stablecoins represent reliable, protocol-level cash flow, making them crypto’s killer use case.
Research Newsletter
Each week the 21Shares Research team will publish our data-driven insights into the crypto asset world through this newsletter. Please direct any comments, questions, and words of feedback to research@21shares.com
Disclaimer
The information provided does not constitute a prospectus or other offering material and does not contain or constitute an offer to sell or a solicitation of any offer to buy securities in any jurisdiction. Some of the information published herein may contain forward-looking statements. Readers are cautioned that any such forward-looking statements are not guarantees of future performance and involve risks and uncertainties and that actual results may differ materially from those in the forward-looking statements as a result of various factors. The information contained herein may not be considered as economic, legal, tax or other advice and users are cautioned to base investment decisions or other decisions solely on the content hereof.


Stablecoins: The real powerhouse of crypto

BE29 ETF är en portfölj företagsobligationer med förfall 2029

Guld-ETFer slår Bitcoin-ETFer kraftigt under första kvartalet 2025

INGH ETF är en satsning på global infrastruktur

SPFT ETF är en global satsning på teknikföretag

Fonder som ger exponering mot försvarsindustrin
Crypto Market Risks & Opportunities: Insights on Bybit Hack, Bitcoin, and Institutional Adoption

Montrose storsatsning på ETFer fortsätter – lanserar Sveriges första globala ETF med hävstång

Warren Buffetts råd om vad man ska göra när börsen kraschar

Svenskarna har en ny favorit-ETF
-
 Nyheter4 veckor sedan
Fonder som ger exponering mot försvarsindustrin
-

 Nyheter3 veckor sedan
Crypto Market Risks & Opportunities: Insights on Bybit Hack, Bitcoin, and Institutional Adoption
-
 Nyheter2 veckor sedan
Montrose storsatsning på ETFer fortsätter – lanserar Sveriges första globala ETF med hävstång
-
 Nyheter4 veckor sedan
Warren Buffetts råd om vad man ska göra när börsen kraschar
-
 Nyheter3 veckor sedan
Svenskarna har en ny favorit-ETF
-

 Nyheter2 veckor sedan
MONTLEV, Sveriges första globala ETF med hävstång
-

 Nyheter4 veckor sedan
Fastställd utdelning i MONTDIV mars 2025
-

 Nyheter2 veckor sedan
Sju börshandlade fonder som investerar i försvarssektorn