
Nyheter
Energy ETPs all the rage

ETF Securities Commodity Research: Review of 2015 Commodity ETP Flows Energy ETPs all the rage
- Bargain hunters drive strong energy ETC inflows defying the oil price slide of 2015
- Precious metal ETP outflows cast a shadow in 2015 weighed by the stronger dollar and the indecisiveness of the Fed.
- Steady rise of inflows over the course of H2 2015 into diversified basket ETPs underpin hopes of a commodity turnaround
Download the complete report (.pdf)
2015 will be remembered as one of the most volatile years for commodities, facing the repercussions of a structural slowdown in China, rising geopolitical risks and the Volkswagen emissions scandal. Asset under management (AUM) in commodity ETPs ended the year lower owing to a significant price impact of -20% and a meagre -1% of flows. Redemptions in gold ETPs were the largest sector contributor to the decline in AUM. In contrast, energy ETPs continued to accumulate assets, as investor inflows surged by 407%, more than offsetting the energy price decline.

(Click to enlarge)
Commodity flows by sector
Commodity ETP flows during the course of the year were extremely uneven. March, April, June and July experienced outflows of nearly US$2.4bn, while the remaining months saw positive inflows. The second half of the year witnessed a steady rise of inflows into diversified baskets, highlighting investor’s preference for strategic portfolio diversification against a backdrop of multi-year low prices.
Outflows were at their heaviest in March 2015, driven mainly by precious metals. Gold in particular, bore the brunt of the US rate hike speculation after robust jobs numbers sent the US dollar higher. Optimism about the global recovery spurred by monetary easing from China and rising sentiment over Greece’s third bailout package reduced gold’s safe haven status, leading to outflows from precious metal ETPs in June and July. As speculation of the first US rate hike in years gained precedence and came to fruition in December, outflows from gold ETPs led the pace of declines in precious metal ETPs.
October faced the onslaught of the Volkswagen emission scandal that impacted palladium (known for its use in gasoline auto catalysts) favourably but dented sentiment for platinum (known for its use in diesel auto catalysts). Negative sentiment emanating from the emissions scandal has underlined a clear disconnect between rising auto sales in Europe and US and plunging prices of platinum group metals known for their majority of use in pollution abatement technology.
Energy ETPs accounted for majority of the outflows in April and May, owing to profit taking and uncertainty over the potential ramp up of oil production from Iran. Furthermore OPECs affirmation of its production ceiling of 30mn barrels per day added to withdrawals from energy ETPs in June. Speculation over production cuts by OPEC and downward revisions in oil output gained precedence in August, driving consistent positive energy ETP flows.

(Click to enlarge)
Interestingly, global production cuts by miners, coupled with an 18% rise in copper imports by China in September buoyed sentiment towards copper in H2 2015. In October a rise in outflows from short copper ETPs marked the most aggressive cut in short ETP positions since June 2014.
Vagaries of oil ETP flows vs price
Oil flows fluctuated over the course of the year, with bargain hunters building positions during oil price corrections. Outflows from WTI and Brent crude oil ETPs occurred from April to June after a build-up of positions in the first quarter of 2015, as oil prices rallied. Mid- year we again saw bargain hunters drive inflows into energy ETPs, despite the overhang of an oversupplied market and the prospect of the Iranian nuclear deal being approved. The WTI- Brent spread moved wider over the H2 of 2015, reaching nearly US$8/bbl in late August/early September. The spread widened partly due to reduced Libyan supply resulting from unrest and escalations of tension in Syria spurring investors to take bullish bets on Brent crude. September was the only month that saw contrasting flows in Brent and WTI crude. Steep price declines in the last quarter of 2015 saw investors continue to pour funds into energy ETPs.

(Click to enlarge)
Broad commodity ETP Flows
With hopes pinned on a turn in the commodity cycle, we saw 50% rise in net flows head to broad diversified basket ETPs.

(Click to enlarge)
In terms of broad sector commodity ETP flows, the contrast between 2014 and 2015 is striking. Precious metal and energy ETP flows more than outpaced the prior year. It has to be noted that energy ETP creations rose by 147% in 2015. Meanwhile, industrial metal ETP flows fell by 210% compared to 2014, owing to concerns surrounding a slowing Chinese economy.

(Click to enlarge)
Few commodities were able to escape the global commodity market rout in 2015 and most of those that did saw price increases due to the positive effects of the El Nino-related weather problems. Agricultural commodities led by cocoa, cotton and sugar earned the top spots on the league table for best performing commodities in 2015. Sugar recorded a price rise of 32% from 23 Sep 2015 to the end of the year owing to the ongoing wet weather in Brazil, the El-Nino related drought in India in the summer and production problems in Thailand. On the other hand the strong El-Nino was responsible for the record warm December experienced across the United States and Europe and added to downward price pressure in the energy sector in the second half of 2015.
Stock-exchange traded turnover in commodity ETPs started the year at a record high of US $4.6bn with energy ETPs remaining the key driver. This level tapered off over the year and peaked again in July owing largely to precious metal ETPs. Gold suffered the largest turnover as market sentiment towards the yellow metal started to wane in response to rising lead indicators of growth in US and Europe coupled with net long positioning in gold falling to its lowest level since June 2013.

(Click to enlarge)
For more information contact
ETF Securities Research team
ETF Securities (UK) Limited
T +44 (0) 207 448 4336
E info@etfsecurities.com
Important Information
General
This communication has been issued and approved for the purpose of section 21 of the Financial Services and Markets Act 2000 by ETF Securities (UK) Limited (“ETFS UK”) which is authorised and regulated by the United Kingdom Financial Conduct Authority (the “FCA”).
The information contained in this communication is for your general information only and is neither an offer for sale nor a solicitation of an offer to buy securities. This communication should not be used as the basis for any investment decision. Historical performance is not an indication of future performance and any investments may go down in value. This document is not, and under no circumstances is to be construed as, an advertisement or any other step in furtherance of a public offering of shares or securities in the United States or any province or territory thereof. Neither this document nor any copy hereof should be taken, transmitted or distributed (directly or indirectly) into the United States.


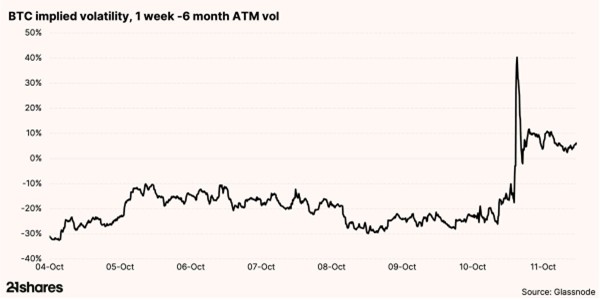
During and after the US market close on Friday, cryptocurrency markets experienced their largest liquidation event on record, with an estimated $19 billion in leveraged positions unwound across futures and perpetual swap markets.

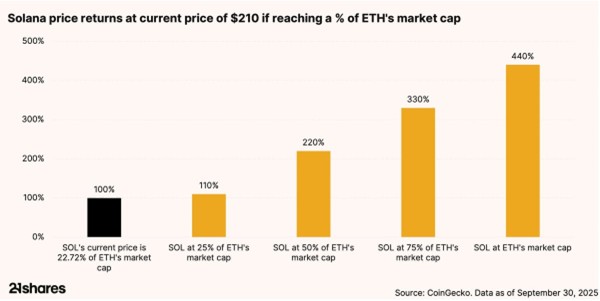
We expect Solana to reach beyond $330. Here’s why
Solana’s growth is underpinned by real fundamentals – measurable cash flows, rising user activity, and expanding economic metrics that rival multibillion dollar growth-tech companies. As Solana transitions from a speculative narrative to a revenue-generating powerhouse, traditional valuation tools like discounted cash flow (DCF) models are becoming increasingly relevant in assessing its long-term potential.


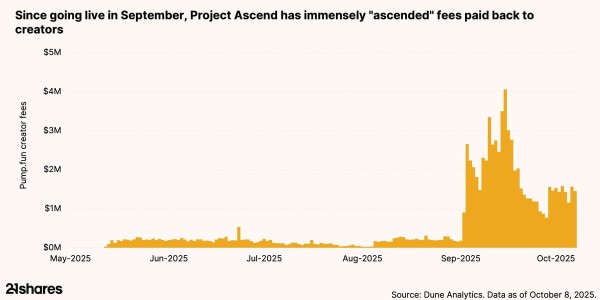
Tokenized attention: Pump.fun and the rise of Creator Capital Markets
The internet’s most valuable commodity is attention – and in 2025, that attention is becoming tokenized. Few projects embody this transformation more vividly than Pump.fun, a Solana-based platform that began as a meme-coin launchpad and has rapidly evolved beyond that use case. Launching Project Ascend in September, Pump.fun introduced Creator Capital Markets (CCM) – a suite of tools that lets streamers and influencers tokenize their audiences.

Research Newsletter
Each week the 21Shares Research team will publish our data-driven insights into the crypto asset world through this newsletter. Please direct any comments, questions, and words of feedback to research@21shares.com
Disclaimer
The information provided does not constitute a prospectus or other offering material and does not contain or constitute an offer to sell or a solicitation of any offer to buy securities in any jurisdiction. Some of the information published herein may contain forward-looking statements. Readers are cautioned that any such forward-looking statements are not guarantees of future performance and involve risks and uncertainties and that actual results may differ materially from those in the forward-looking statements as a result of various factors. The information contained herein may not be considered as economic, legal, tax or other advice and users are cautioned to base investment decisions or other decisions solely on the content hereof.


JEYH ETF är högavkastande obligationer hedgade i euro

Record crypto liquidations amid tariff shock

VALOUR VIRTUAL SEK följer priset på VIRTUAL, Virtuals Protocols egna token

Crypto market update: record liquidations amid tariff shock

Hur investera i Blockchain med hjälp av börshandlade fonder

HANetf och Infrastructure Capital Advisors samarbetar för att lansera aktivt förvaltad preferensavkastnings-ETF i Europa

IN0A ETF spårar S&P 500 med fokus på företag med höga ESG-betyg

YSLV ETP ställer ut köpoptioner på silver för att skapa en löpande avkastning

De bästa lågvolatilitets ETFer på marknaden
PLTY ETP utfärdar optioner mot aktier i Palantir
-
 Nyheter4 veckor sedan
HANetf och Infrastructure Capital Advisors samarbetar för att lansera aktivt förvaltad preferensavkastnings-ETF i Europa
-
 Nyheter4 veckor sedan
IN0A ETF spårar S&P 500 med fokus på företag med höga ESG-betyg
-
 Nyheter4 veckor sedan
YSLV ETP ställer ut köpoptioner på silver för att skapa en löpande avkastning
-
 Nyheter3 veckor sedan
De bästa lågvolatilitets ETFer på marknaden
-

 Nyheter4 veckor sedan
PLTY ETP utfärdar optioner mot aktier i Palantir
-

 Nyheter4 veckor sedan
Time in Bitcoin beats timing Bitcoin
-

 Nyheter4 veckor sedan
Investera i NEAR med en börshandlad produkt
-

 Nyheter4 veckor sedan
HANetf kommenterar kopparuppgången