
Nyheter
Downside Scenario Comes to the Fore

Monthly Update Downside Scenario Comes to the Fore. ETF Securities Research and Roubini Global Economics
Downside Scenario Comes to the Fore
• The global economy continues to be buffeted by the series of financial shocks and knock-on uncertainty since last spring, with China supplanting the Fed’s decision-making as the main source of concern. Recent economic momentum in the U.S. has seemed softer, possibly delaying the Fed’s “lift-off” into 2016.
• The base case we expressed in our Q4 Quarterly Outlook “What Happens When U.S. Interest Rates Rise” implies gains for many risky assets from current levels, but seems less likely to occur than earlier in the year (65% probability, down from 75%). In this monthly update, we take the opportunity to describe the risks around this central scenario, with, in our view, the probability of an adverse global scenario over the medium term now standing at around 30% (up from 15%). Our positive risk scenario, meanwhile, appears to be extremely unlikely (5%, down from 10%).
• What to watch this month: The ECB publishes its economic bulletin, perhaps providing further clues about the extension of its quantitative easing programme (November 5); Bank of England policy meeting (November 5), for indications about how long it will keep its policy rate at 0.50%; Brazil’s leading party holds its annual convention (November 15)—look for clues about whether the economy’s vital fiscal adjustment will progress.
Heatmap: Roubini’s 2016 Growth Forecasts (%, y/y)

Source: Roubini Global Economics
Key Theme: Odds of a Global Recession Increase
The world continues to be buffeted by the series of financial shocks and knock-on uncertainty since last spring, with China supplanting the Fed as the main source of concern. In our view, the probability of an adverse global scenario over the medium term (12-18 months) has increased.
Shocks Buffet the Global Economy
Steady but sub-par emerging-market aggregate growth masks considerable divergence and economic and financial risks.
Developed markets are not completely immune to the global market stresses, with some signs of slowdown, particularly in the U.S. Commodity prices have tumbled amid a prolonged glut and, in our view, overly pessimistic analyst forecasts on China. Commodity exporters are therefore being hobbled—Brazil and Russia, in particular—and several others are suffering meaningfully, with exchange rates absorbing the bulk of the terms-of-trade shock.
Meanwhile, more open nations are struggling as a result of the softer global trade growth.
One of the themes we highlighted in our last quarterly was the heightened risk of a downside scenario for the global economy and markets. The knock-on tightening of financial conditions and weaker U.S. growth momentum has increased the chance of an adverse global economic scenario, as these negative macroeconomic forces interact with the rise in the external debt of and local currency outflows from emerging markets.
Greater Risks Around Our Central Scenario
The base-case of a modest expansion that we described in our Q4 Quarterly Outlook (around 3% global growth) is somewhat less likely than in previous Quarterly Outlooks (we see a probability of 65%, from 75% earlier in the year), and the likelihood of our positive scenario occurring (S&P at 2350, EMBIG spreads sub-300) has slipped to just 5% from 10% over a 12-18-month horizon. Both trends have been reinforced by the macro data in September and early October.
It follows that we have increased the odds of an adverse global scenario in the medium term (2016-17) to 30% (from 15%), because of the higher likelihood that:
• China’s slowdown will be worse than the bumpy landing we project;
• Emerging-market portfolio outflows will lead to further pressures on currencies and credit growth, especially in commodity producers; and
• Spill-overs to financial markets will spark greater risk aversion and lead to a slower pace of Fed rate hikes.
These risks have grown following the increase in risk appetite in light of markets discounting early Fed hikes.
How Would the Adverse Case Play Out?
In our downside case, global growth slows to under 2% in 2016, implying rising unemployment and financial stress. Emerging markets face the greatest downside risks. Their developed counterparts can partially “decouple”, protected by delays to hikes in the U.S. and UK and further “unconventional” easing in the Eurozone and Japan. These will also support more developed, open emerging markets.
Under this scenario, we would see emerging markets experiencing a larger shock of a 2-3% decline in growth, with Asian trading nations and commodity producers in Latin America and Africa most affected.
A China slowdown (to 4% growth) is a possible catalyst: That would, according to both our own and external econometric estimates, lead to a 0.9% growth decline across developed markets, with the U.S. least affected and Japan the most. That said, while we recognise China’s risks, we do not expect an out of control “hard” landing. With exports and domestic demand picking up, we see no reason for the renminbi to depreciate sharply. In our baseline, volatility and risk aversion will continue until concerns about China eventually abate.
Asset-Class Implications: Fixed Income
Sovereign bonds—DMs to outperform EMs
We continue to expect only a modest rise in U.S. bond yields, and believe the pressures associated with emerging-market reserve selling will not have much effect on Treasurys.
In fact, the latter is more likely to be associated with lower risk-free yields. Meanwhile, we expect expanded quantitative easing in the Eurozone and Japan to hold down sovereign yields there.
The delayed rate hikes from the Fed and easing in Europe could prompt more easing/delayed hikes from other G10 central banks. We expect the Bank of Canada to cut more than once in December in light of the slack in the labor market and spill-overs from the U.S. late-cycle slowdown.
Emerging Markets Have Little Space to Ease
The shorter end of most emerging-market curves looks more vulnerable to repricing, with many curves (such as the Mexican, South African and Colombian curves) already steep and Brazil’s elevated due to fiscal/political uncertainty.
Most Asian central banks will likely stay on hold, except for India, which could cut more.
In the broad Central and Eastern Europe, Middle East and Africa region, we believe Hungary and Russia could do additional easing, but only towards year-end. Turkey will likely keep rates stable until 2016 due to political pressures, while South Africa could continue its tightening cycle in November.
In Latin America, despite mounting pressure to cut, we expect Brazil to keep policy rates on hold, cutting only in Q2 2016 or when inflation falls and the fiscal policy anchor is credible.

Rather than hiking rates, we believe the Brazilian Central Bank will instead increase the stock of foreign-exchange swaps, or even resort to direct interventions using its ample cushion of foreign reserves if the real comes under more pressure.
Focus on European Equity
The modest recovery in the Eurozone is having an outsized impact on company earnings, with the European Central Bank’s impact on rates and the euro helping even the laggards.
In particular, we believe French equities can continue to outperform their German and Spanish counterparts through the medium term.
Even if it is lagging some of its counterparts, the French economy is benefiting from the Eurozone-wide rebound.
The economy grew weakly in H1 (1% y/y), but investment, in decline for the past two years, remains a source of weakness. Consumption has remained the main driver of growth, underpinned by public-sector spending.
This cyclical rebound provides a supportive macro foundation for French equity in the near term.
French Earnings: Solid Catch-Up Potential
Against this backdrop, French corporate earnings prospects look strong and margins show signs of recovery, potentially allowing earnings to outpace GDP. Earnings of listed French firms fluctuate by 25% over the course of the business cycle—in line with the cyclical volatility of German corporate earnings. However, French firms are less affected by swings in global trade than their German counterparts.
Since we noted weakness in earnings momentum a year ago, French earnings, supported by the weaker euro, have reversed course and registered the highest revision sentiment score over the past 12 months.
Moreover, they are still 25% below their 2008 peak, offering good catch-up potential relative to Germany, where earnings have already rebounded.
The weak euro has been a particular boon to France’s industrial sector, which accounts for 20% of total corporate earnings (greater than the German, Spanish and Italian figures).
The prospect of an expansion of the European Central Bank’s quantitative easing program implies further Euro depreciation—a source of near-term support for French equity.
Asset Class Implications: Commodities

Up until a week ago, futures markets were shifting out their expectations for the Fed’s next rate hike. However, the latest FOMC meeting statement (28th October) downplayed the global risks that were driving markets expectations out. On 3rd of November, the probability of a rate hike in December according to the futures market had risen to 50%, moving closer in line with Roubini Global Economics’ forecast.
To the extent that increasing Fed fund rates expectations raise real interests rates, the latest development could be viewed as gold-price negative.

However, demand for the precious metal from China in recent months has picked up significantly, adding a significant source of support for the metal. Net Chinese imports from Hong Kong in September 2015 rose to the highest level since February 2014.

Asset-Class Implications: Foreign Exchange
Interestingly, during four of the past five Federal Reserve tightening cycles, the US Dollar Index (DXY) has declined. This is contrary to what would normally be expected with higher interest rates and certainly is contrary to current consensus for the USD in the coming year.


It could be misleading to generalise and extrapolate to the current environment. Indeed, it appears there are several factors at play during these episodes, ranging from the mid-1970s to 2006.
The US Federal Reserve appears to be once again focussing on the outlook for the local US economy, in the wake of the market volatility that stayed its hand at the September meeting.
Although inflation expectations remain subdued, there has been evidence of some inflationary pressure, albeit modest in the system. Should the Fed again hold off in December, there is an increasing chance of policy mistakes down the road. An initial 25bps rate hike is unlikely to derail the economic recovery and raises the prospect of policy mistakes. We expect the US jobs market to remain robust and keep the Fed on course to raise rates in 2015.
Indeed, policy mistakes could be the reason that the ECB seems so committed to additional stimulus: raising rates prematurely in 2011, before cutting them in 2012. Further extension or expansion of the current stimulus measures is likely before year-end 2015 and in turn likely to keep pressure on the Euro.
Disclaimer Title Important Information
Disclaimer Text This communication has been issued and approved for the purpose of section 21 of the Financial Services and Markets Act 2000 by ETF Securities (UK) Limited (“ETFS UK”) which is authorised and regulated by the United Kingdom Financial Conduct Authority (the “FCA”). The information contained in this communication is for your general information only and is neither an offer for sale nor a solicitation of an offer to buy securities. This communication should not be used as the basis for any investment decision. Historical performance is not an indication of future performance and any investments may go down in value. This document is not, and under no circumstances is to be construed as, an advertisement or any other step in furtherance of a public offering of shares or securities in the United States or any province or territory thereof. Neither this document nor any copy hereof should be taken, transmitted or distributed (directly or indirectly) into the United States.


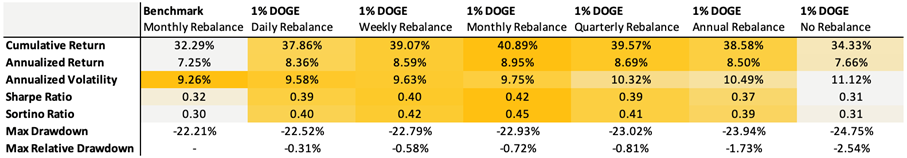
Dogecoin has outperformed other major cryptoassets over the past decade, while also exhibiting a low correlation to crypto and traditional assets. This creates a compelling argument for a portfolio allocation. We tested a Bitcoin-enhanced growth portfolio, which is a traditional 60/40 infused with 3% Bitcoin, and we introduced a modest 1% DOGE allocation. Since most prospective investors likely already hold Bitcoin, this offers a lens into how the two assets can complement each other.
Despite the small portfolio allocation, every approach delivered stronger returns. The benchmark returned 7.25% annually, while DOGE-enhanced portfolios reached as high as 8.95%. Sharpe ratios improved in almost all tests, indicating better risk-adjusted returns. Volatility did slightly tick up, but drawdowns remained largely contained. Even with no rebalancing, the max drawdown only deepened by a few percentage points, underscoring that even a 1% DOGE allocation adds meaningful punch without destabilizing the broader portfolio.
Rebalancing remains essential to capturing upside effectively. Without it, returns can plateau while risk quietly compounds. Monthly or weekly rebalancing offered the best balance, maximizing returns while keeping volatility and drawdowns in check, especially during periods of broader market stress, as we’ve recently seen. Given Dogecoin’s momentum-driven nature, a more strategic approach linked to broader crypto market cycles may offer even greater optimization beyond routine rebalancing.
With the right structure, a 1% allocation to Dogecoin isn’t reckless—it’s rewarding.
Bear Case
Despite strong fundamentals and a rich cultural legacy, Dogecoin’s recent rally, fueled by post-election memecoin mania, may have front-run its true cycle potential. As attention shifts to newer narratives, DOGE risks being seen as ’yesterday’s play,’ potentially underperforming even in a rising market. Still, that wouldn’t signal a flaw in its model, just a pause in a fast-rotating cycle.
Assuming a continued 10% compounded annual growth rate (CAGR) from its 2021 peak of $0.73, DOGE would be projected to land around $0.38 by 2025—still more than 2x from today’s levels but modest relative to past cycles. More notably, this would mark the first time Dogecoin fails to reach a new all-time high in a full market cycle.
Neutral Case
Dogecoin may not dominate headlines like it did at its peak, but it still holds cultural relevance and widespread recognition. In a scenario where the total crypto market cap peaks at $5 trillion this cycle and DOGE maintains a solid, albeit slightly reduced, market share of 3% instead of its previous 4%, this would result in a market capitalization of approximately $150 billion for DOGE.
At that valuation, DOGE would trade near $1 per coin, a ~5.5x gain from current levels around $0.185. This neutral case assumes Dogecoin retains its stature as the leading memecoin, despite increased competition, with stable adoption and renewed retail interest, but without the same euphoria of the last cycle.
Bull Case
If we take DOGE’s bottom price of $0.007 just before the last bull run began and fast-forward two years to the bottom of the current cycle at $0.0585, that move reflects a CAGR of 189%. If DOGE were to mirror this explosive growth, DOGE would reach approximately $1.42.
In this scenario, Dogecoin benefits from renewed memecoin mania, increasing real-world adoption, and stronger interest fueled by regulatory clarity and potential integration with major platforms like Elon Musk’s X. A full return of retail enthusiasm and broad cultural momentum could reestablish DOGE as the breakout asset of the cycle, potentially even doubling its all-time high.

Research Newsletter
Each week the 21Shares Research team will publish our data-driven insights into the crypto asset world through this newsletter. Please direct any comments, questions, and words of feedback to research@21shares.com
Disclaimer
The information provided does not constitute a prospectus or other offering material and does not contain or constitute an offer to sell or a solicitation of any offer to buy securities in any jurisdiction. Some of the information published herein may contain forward-looking statements. Readers are cautioned that any such forward-looking statements are not guarantees of future performance and involve risks and uncertainties and that actual results may differ materially from those in the forward-looking statements as a result of various factors. The information contained herein may not be considered as economic, legal, tax or other advice and users are cautioned to base investment decisions or other decisions solely on the content hereof.


SPFT ETF är en global satsning på teknikföretag

Dogecoin in a portfolio: A small 1% allocation has a loud bark!

VBTC ETN spårar priset på kryptovalutan Bitcoin

iShares och Franklin Templeton listar nya ETFer på Xetra

BE28 ETF företagsobligationer med förfall 2028 och inget annat

Fonder som ger exponering mot försvarsindustrin
Crypto Market Risks & Opportunities: Insights on Bybit Hack, Bitcoin, and Institutional Adoption

Montrose storsatsning på ETFer fortsätter – lanserar Sveriges första globala ETF med hävstång

Warren Buffetts råd om vad man ska göra när börsen kraschar

Svenskarna har en ny favorit-ETF
-
 Nyheter4 veckor sedan
Fonder som ger exponering mot försvarsindustrin
-

 Nyheter3 veckor sedan
Crypto Market Risks & Opportunities: Insights on Bybit Hack, Bitcoin, and Institutional Adoption
-
 Nyheter2 veckor sedan
Montrose storsatsning på ETFer fortsätter – lanserar Sveriges första globala ETF med hävstång
-
 Nyheter4 veckor sedan
Warren Buffetts råd om vad man ska göra när börsen kraschar
-
 Nyheter3 veckor sedan
Svenskarna har en ny favorit-ETF
-

 Nyheter2 veckor sedan
MONTLEV, Sveriges första globala ETF med hävstång
-

 Nyheter4 veckor sedan
Fastställd utdelning i MONTDIV mars 2025
-

 Nyheter2 veckor sedan
Sju börshandlade fonder som investerar i försvarssektorn