
Nyheter
Cryptoassets Included in A Diversified Portfolio
When one considers investing in a given asset class and subsequently a specific asset – two primary questions should be asked:
- What is the investment thesis for this asset class?
- What proportion of a portfolio should be allocated to this asset class given current financial goals and constraints?
This primer will provide the answer to the second question (2). At its core, the question is optimal portfolio construction and the risk management of said portfolio for a given set of constituents. For brevity, we will assume the reader understands basic Modern Portfolio Theory but perhaps is less familiar with cryptoasset terminology and will define and expand on concepts where deemed necessary. Our report’s key argument is that adding cryptoasset exposure will lead to superior risk-adjusted investment outcomes precisely due to their unique property of having largely unrelated risk premiums compared to all other asset classes.
Coverage
- Correlation of Returns Across Asset Classes
- Correlation of Returns During Distressed Times
- Portfolio with Different Rebalancing Frequencies
- Dynamic Allocation with Blockchain Indicators
- Conclusion
- Disclaimer
Correlation of Returns Across Asset Classes
In Figure 1, we compare the correlation of returns for several major asset classes, represented by popular exchange-traded funds (ETFs), as well as Bitcoin (BTC) and Ether (ETH). The ETFs chosen represent a variety of asset classes and risk profiles and are as follows:
• US Equity, represented by SPY – The SPDR S&P 500 ETF
• Developed Equity, represented by EFA – The iShares MSCI EAFE ETF
• Emerging Equity, represented by EEM – The iShares MSCI Emerging Markets ETF
• US Bond, represented by AGG – The iShares Core U.S. Aggregate Bond ETF
• US Long Term Treasury, represented by TLT – The iShares 20+ Year Treasury Bond ETF
• Real Estate, VNQ – The Vanguard Real Estate ETF
• Gold, GLD – The SPDR Gold Shares ETF
• ARK Innovation, represented by ARKK
Bitcoin’s correlation with major asset classes ranges from 0.00 to 0.27 (excluding Ethereum), similar to what Gold (GLD) offers, ranging from 0.06 to 0.23 from December 12, 2014 to September 30, 2023. This low level of correlation made both assets a vital diversification source for traditional portfolios, which are a mix of equities and bonds. However, there is almost no correlation (0.10) between gold and Bitcoin, making both unique diversification resources for investors’ portfolios.
Figure 1: Correlation matrix
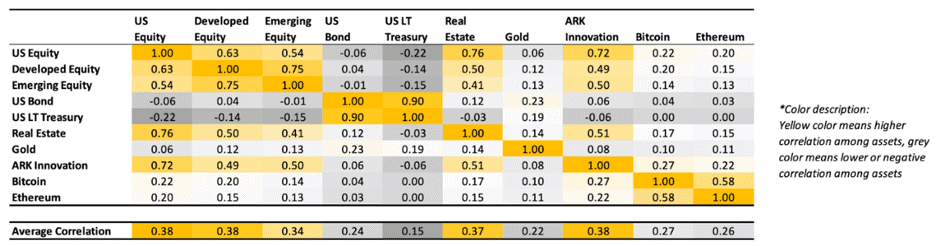
Source: 21Shares. Data from Bloomberg and Yahoo Finance (BTC and ETH). From 31/12/2014 to 30/09/2023
Correlation of Returns During Distressed Times
March 2020 (Covid Crash)
During distressed times, asset classes tend to show an increased correlation between them. The stock market crash and liquidity crisis caused by the COVID-19 pandemic exemplify this pattern. Figure 2 shows that the significant and sudden global event that began in March 2020 and ended in April caused both Bitcoin and gold to undergo a sudden rise in correlation.
Figure 2: Correlation of returns during March 2020 (Covid Crash)
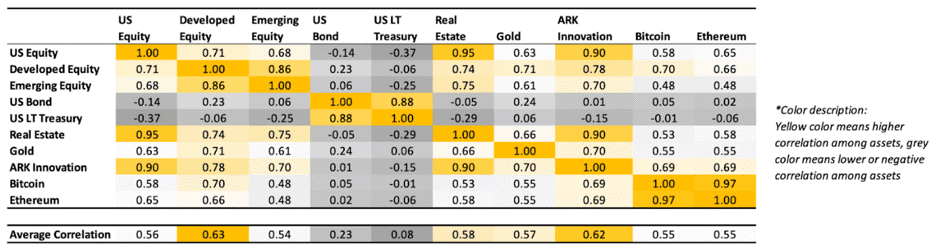
Source: 21Shares. Data from Bloomberg and Yahoo Finance (BTC and ETH)
March 2023 (Banking Crisis)
Bitcoin rallied 23% in March 2023 on the back of a looming banking crisis in the U.S. On March 13, the Federal Reserve had to step in to protect all depositors of Silicon Valley Bank, which experienced a bank run two days before, and of crypto-friendly Signature Bank, controversially shut down by its state chartering authority. Then, on March 19, UBS agreed to buy Credit Suisse in an emergency rescue deal brokered by Swiss authorities. Meanwhile, Figure 3 shows that BTC decoupled from risk assets like stocks and showed an increased correlation to Gold as investors turned to it as a hedge against bank risk.
At its core, Bitcoin is a non-sovereign and global asset that exhibits unique characteristics (trustless, permissionless, and censorship-resistant, among others). Indeed, one of Satoshi Nakamoto’s primary motivations for creating Bitcoin was to have an alternative payment system outside central banks’ control.
Figure 3: Correlation of returns during March 2023 (Banking Crisis)
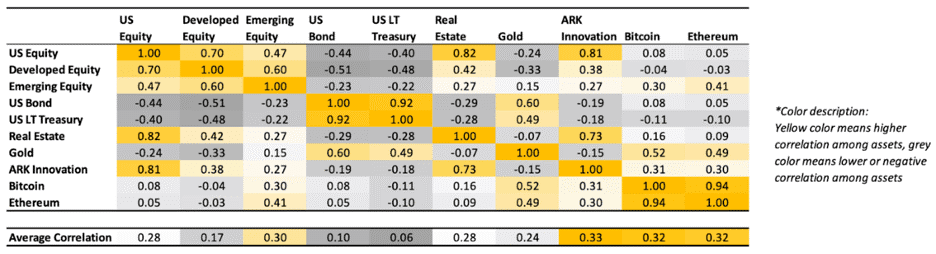
Source: 21Shares. Data from Bloomberg and Yahoo Finance (BTC and ETH)
Portfolio with different rebalancing frequencies
We choose a traditional 60/40 portfolio (60% allocated to stocks, 40% allocated to bonds) as the hypothetical benchmark, as it has been a guidepost for the average investor since Nobel laureate Harry Markowitz developed the principles of Modern Portfolio Theory (MPT) in the 1950s. For brevity, we assume the reader has a good understanding of MPT. Then, we backtest adding a 1% and 5% Bitcoin or Ether allocation to said diversified portfolio to understand the impact of a minor allocation to crypto across various performance metrics. Before diving into the results, the reader should be aware that this hypothetical portfolio was developed in hindsight, and past performance is no guarantee of future results.
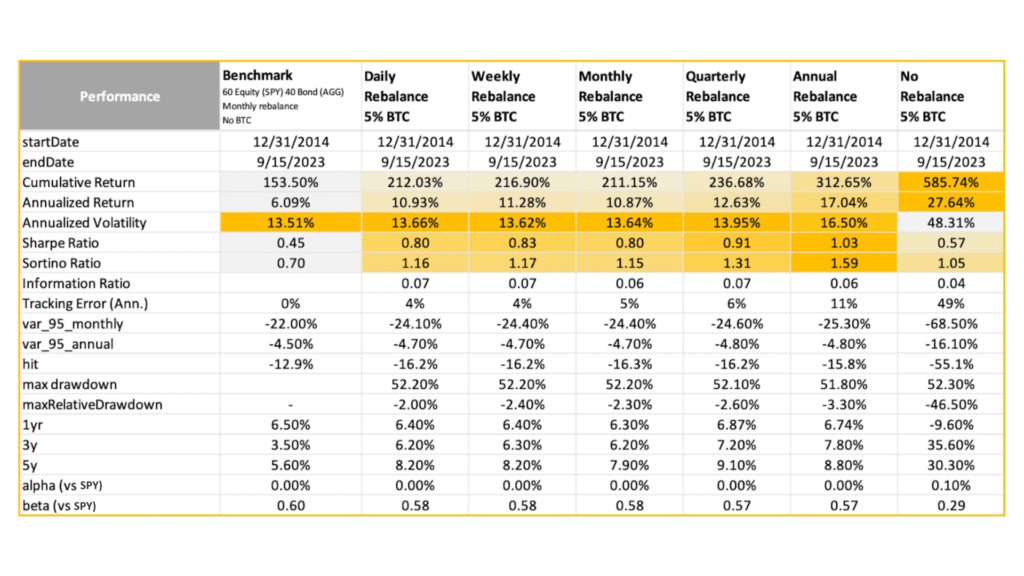
5% BTC allocation to a simple growth portfolio (60% US Equity, 40% US Bond)
We tested six types of rebalancing strategies by adding 5% constant BTC allocation to a simple growth portfolio (US Equity – 60% represented by SPY, US Bond – 40% represented by AGG): daily, weekly, monthly, quarterly, annually, and no rebalancing. These are the key takeaways:
• Improved risk-adjusted returns: The inclusion of cryptoassets in the diversified portfolio is noticeable with improved overall performance across all rebalance frequencies, improving annualized return from 6.09% to double digits range (from 10.87% to 27.64%) and enhancing Sharpe ratio from 0.45 to the 1.03 level.’
• Rebalancing is key: However, when adding Bitcoin without rebalancing, overall risk suffers with 48.31% annualized volatility, almost four times higher than the benchmark of 13.51%. The most efficient rebalancing schedule is annual. This strategy has historically proven to be maximizing cumulative returns (313%) and the Sharpe (1.03) and Sortino (1.59) ratios.
• Timing doesn’t really matter: As investors argue that timing matters in crypto investments, the research showed regardless of when to add bitcoin to their portfolio, 75% of the time, the strategy outperformed the benchmark in the next 1 year, and 100% of the time, the strategy exceeded it in the next 3 years.
Figure 4: Growth portfolio with different rebalancing frequencies (5% BTC allocation)
Source: 21Shares. Data from Yahoo Finance
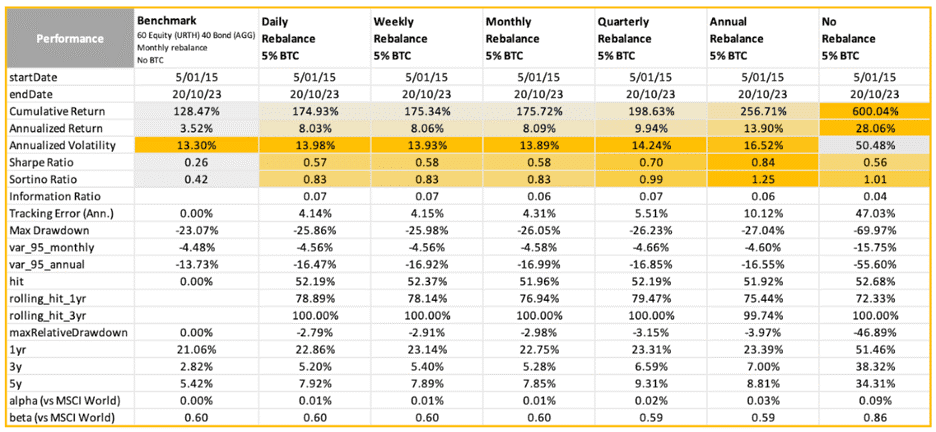
5% BTC allocation to another simple growth portfolio (60% MSCI World, 40% US Bond)
We also tested six types of rebalancing strategies by adding 5% constant BTC allocation to another growth portfolio (MSCI World – 60% represented by URTH, US Bond – 40% represented by AGG): daily, weekly, monthly, quarterly, annually, and no rebalancing. These are the key takeaways:
• Improved risk-adjusted returns: The inclusion of BTC in the diversified portfolio was noticeable with improved overall performance across all rebalance frequencies, improving annualized return from 3.52% to double digits range (13.90% with an annual rebalance) and enhancing Sharpe ratio from 0.26 to the 0.84 level.
• Rebalancing is key: However, when adding bitcoin without rebalancing, overall risk suffers with 50.48% annualized volatility, almost four times higher than the benchmark of 13.30%. The most efficient rebalancing schedule is annual. This strategy has historically proven to be maximizing cumulative returns (256.71%) and the Sharpe (0.84) and Sortino (1.25) ratios.
• Timing doesn’t really matter: As investors argue that timing matters in crypto investments, the research showed regardless of when to add bitcoin to their portfolio, 80% of the time, the strategy outperformed the benchmark in the next 1 year, and 100% of the time, the strategy exceeded it in the next 3 years.
Figure 5: Another growth portfolio with different rebalancing frequencies (5% BTC allocation)
Source: 21Shares. Data from Yahoo Finance
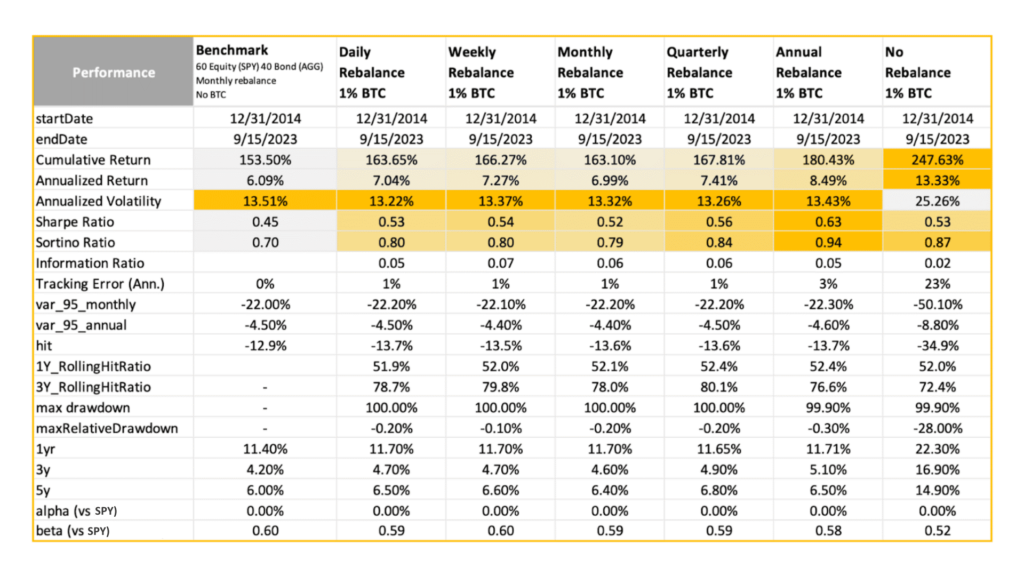
1% BTC allocation to a simple growth portfolio (60% US Equity, 40% US Bond)
We also tested six types of rebalancing strategies by adding just 1% constant bitcoin allocation to a simple growth portfolio (US Equity – 60%, US Bond – 40%): daily, weekly, monthly, quarterly, annually, and no rebalancing (see next slide). These are the key takeaways:
• Improved risk-adjusted returns: The inclusion of Bitcoin in the diversified portfolio is noticeable, with improved overall performance across all rebalance frequencies, improving annualized return and enhancing the Sharpe ratio from 0.45 to 0.63.
• Rebalancing is key: Surprisingly, adding just 1% constant bitcoin allocation also reduced annualized volatility across all rebalance frequencies, except no rebalancing, in which case overall risk suffers with 25.47% annualized volatility. The reduction in annualized volatility to bitcoin’s low correlation to equities and bonds.
• Timing doesn’t really matter: As investors argue that timing matters in crypto investments, the research showed regardless of when to add bitcoin to their portfolio, 75% of the time, the strategy outperformed the benchmark in the next 1 year, and 100% of the time, the strategy exceeded it in the next 3 years.
Figure 6: Portfolio with different rebalancing frequencies (1% BTC allocation)
Source: 21Shares. Data from Yahoo Finance
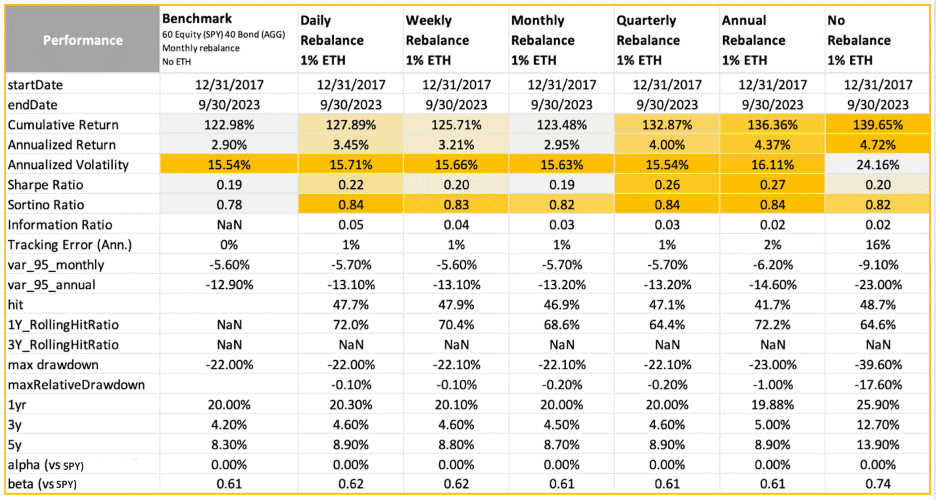
1% ETH allocation to a simple growth portfolio (60% US Equity, 40% US Bond)
In addition, we tested six types of rebalancing strategies by adding 1% constant ETH allocation to a simple growth portfolio (US Equity – 60%, US Bond – 40%): daily, weekly, monthly, quarterly, annually, and no rebalancing (see next slide). These are the key takeaways:
• Improved risk-adjusted returns: The inclusion of Ether in the diversified portfolio is noticeable with improved overall performance across all rebalance frequencies, improving annualized returns and enhancing the Sharpe ratio from 0.19 to 0.27.
• Rebalancing is key: However, when adding ETH without rebalancing, overall risk suffers with 24.16% annualized volatility, almost double the benchmark of 15.54%. The most efficient rebalancing schedule is quarterly. This strategy achieves the same volatility as the benchmark portfolio while improving the Sharpe (0.26) and Sortino (0.84) ratios.
• Timing doesn’t really matter: As investors argue that timing matters in crypto investments, the research showed regardless of when to add bitcoin to their portfolio, 70% of the time, the strategy outperformed the benchmark in the next 1 year, and 100% of the time, the strategy exceeded it in the next 3 years.
Figure 7: Portfolio with different rebalancing frequencies (1% ETH allocation)
Source: 21Shares. Data from Yahoo Finance
Dynamic Allocation with Blockchain Indicators
The Case for Market Value to Realized Value (MRVR)
Transparency of public blockchains has proven beneficial to gauging investor sentiment; though transactions are pseudonymous, timestamps and transaction values are visible and humanly readable. This certainly helps shed light on the potential psychology of BTC investors based on their cost basis. As mentioned in a book authored by Morgan Housel, The Psychology of Money, “Investing is not the study of finance. It’s the study of how people behave with money.”
The market-value-to-realized-value (MVRV) is a simple yet powerful blockchain (on-chain) multiple:
• ”Market value” refers to the current value of an asset (market cap).
• ”Realized value” refers to the aggregated cost basis of investors (realized cap). This metric was proposed by Nic Carter and Antoine Le Calvez in 2018. Using the vocabulary of the crypto industry, it is the aggregate value of all unspent transaction outputs (UTOXs) priced by their value when they last moved.
High MVRV values indicate a substantial degree of unrealized profits in the system. In contrast, values below ”1” indicate that a significant portion of BTC’s supply is near break-even or at a loss. Remember, investing is also the study of how people behave with money. Historically, high MRVR ratios have coincided with BTC market tops, while values below ”1” have preceded past cycles’ bottoms. BTC’s MVRV ratio broke above the ”1” mark in January this year. The last time this happened was in March 2020, marking the beginning of the previous cycle’s meteoric bull run.
Figure 8: Bitcoin’s Market Value to Realized Value (MVRV)
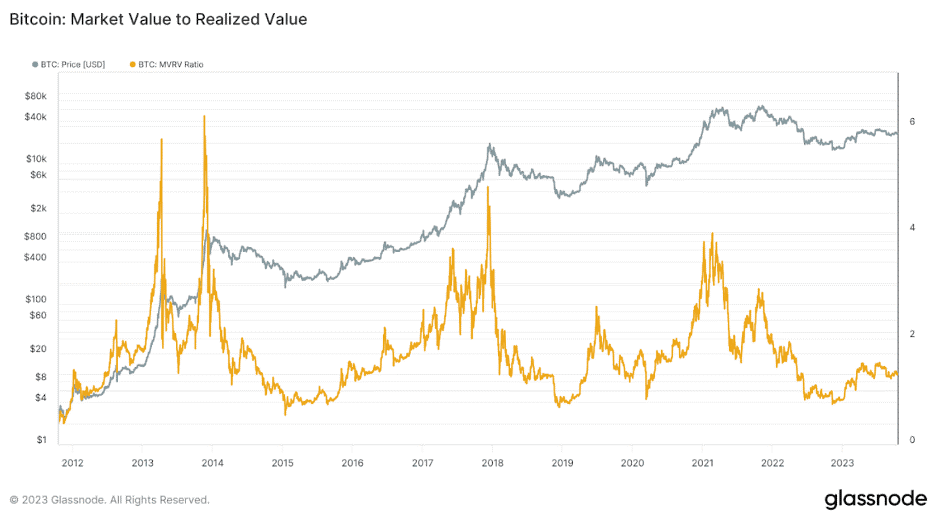
Source: Glassnode
Here’s how we constructed a dynamic rebalancing strategy based on the MVRV ratio. Our algorithm sets a logic to gradually increase the rebalancing weight towards distress times and vice versa. Here is the breakdown of the MVRV strategy:
• Monthly rebalance.
• Benchmark is a 60/40 (60% allocated to SPY and 40% to AGG) portfolio with a 5% constant BTC allocation.
• Rebalancing: MVRV driven.
• 90% of the portfolio is allocated to a 60/40 strategy.
• 10% of the portfolio is allocated to BTC and cash based on the MVRV indicator. BTC allocation is higher when MVRV is at low levels relative to its historical average and vice versa.
As shown in the chart below (Figure 8), with the above strategy, a dynamic allocation strategy driven by the MVRV ratio enhances an ongoing BTC allocation strategy on almost all performance metrics. Annualized return improved by ~8% per year with a similar level of risk; both the Sharpe and Sortino ratios improved, which showed the effectiveness of the fundamental indicator in preserving capital during market downtrends.
Figure 9: MVRV-based dynamic allocation
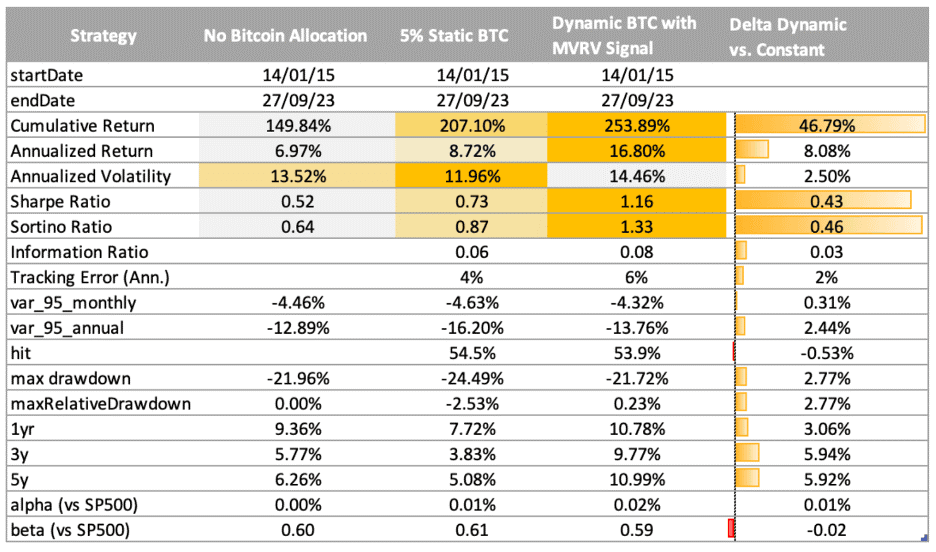
Source: 21Shares. Data from Yahoo Finance
Conclusion
This report has demonstrated the benefits of allocating a portion of one’s portfolio to Bitcoin and Ethereum through a thorough backtest over history. The core reason is historical evidence that cryptoassets give investors a chance to diversify their portfolios further and maximize risk-adjusted returns. The unique dynamics of the cryptoasset industry ensure that the critical value drivers for Bitcoin or Ethereum bear little relationship to the value drivers of stocks, fixed incomes, or alternative investments. What makes cryptoasset investing considerable is its potential to improve the risk profile by magnitudes. The often-volatile risk profiles of cryptoassets must be judged as just one part of an investor’s whole portfolio. Rebalancing is needed to harvest the risk premium and maintain the portfolio’s risk profile without significant downside risk exposure during distress periods.
Moreover, our study demonstrated the benefits of dynamic allocation in crypto with fundamental indicators like the MVRV ratio. However, theoretical portfolio allocation is only one aspect of the investment process one must go through before investing; this report has purposely avoided associated topics such as valuation, as these are covered in other writings.
Research Newsletter
Each week the 21Shares Research team will publish our data-driven insights into the crypto asset world through this newsletter. Please direct any comments, questions, and words of feedback to research@21shares.com
Disclaimer
The information provided does not constitute a prospectus or other offering material and does not contain or constitute an offer to sell or a solicitation of any offer to buy securities in any jurisdiction. Some of the information published herein may contain forward-looking statements. Readers are cautioned that any such forward-looking statements are not guarantees of future performance and involve risks and uncertainties and that actual results may differ materially from those in the forward-looking statements as a result of various factors. The information contained herein may not be considered as economic, legal, tax or other advice and users are cautioned to base investment decisions or other decisions solely on the content hereof.


32XG ETF köper bara företagsobligationer med förfall 2032

Europas ETP-marknad bryter 3-biljoners dollar-tröskeln
ISRD ETF investerar i dollardenominerade företagsobligationer

HANetf lanserar Middlefield Canadian Enhanced Income UCITS ETF vilket ger europeiska investerare tillgångar inom aktivt förvaltad kanadensisk utdelning

GinsGlobal Tech Megatrend ETF lägger till kvantberäknings- och försvarsteknik mitt i global innovationsboom

Fokus mot en helt ny börshandlad produkt i september 2025

M5TYs senaste utdelningstakt (55 %) belyser covered call-strategins inkomstpotential

Börshandlade fonder för europeiska small caps

Miners Find Their Mojo as Gold Consolidates
Levler noterar ytterligare fyra börshandlade fonder i Sverige
-
 Nyheter3 veckor sedan
Fokus mot en helt ny börshandlad produkt i september 2025
-
 Nyheter4 veckor sedan
M5TYs senaste utdelningstakt (55 %) belyser covered call-strategins inkomstpotential
-
 Nyheter4 veckor sedan
Börshandlade fonder för europeiska small caps
-
 Nyheter4 veckor sedan
Miners Find Their Mojo as Gold Consolidates
-

 Nyheter2 veckor sedan
Levler noterar ytterligare fyra börshandlade fonder i Sverige
-

 Nyheter4 veckor sedan
State Street och Blackstone lanserar aktivt förvaltade CLO-ETFer i Europa
-

 Nyheter4 veckor sedan
Kärnkraftsavtal mellan Storbritannien och USA väcker förhoppningar om uranboom
-

 Nyheter4 veckor sedan
XMGA ETF spårar amerikanska aktier men exkluderar de största företagen