
Nyheter
Crypto Market Compass 8 July 2024
• Last week, cryptoassets continued to underperform on account ongoing profit-taking by large long-term holders
• Our in-house “Cryptoasset Sentiment Indicator” has declined sharply and signals bearish sentiment again
• Ongoing profit-taking by large long-term holders such as German government entities or the Mt Gox trustee will likely continue to be a headwind over the coming weeks
Chart of the Week
Performance
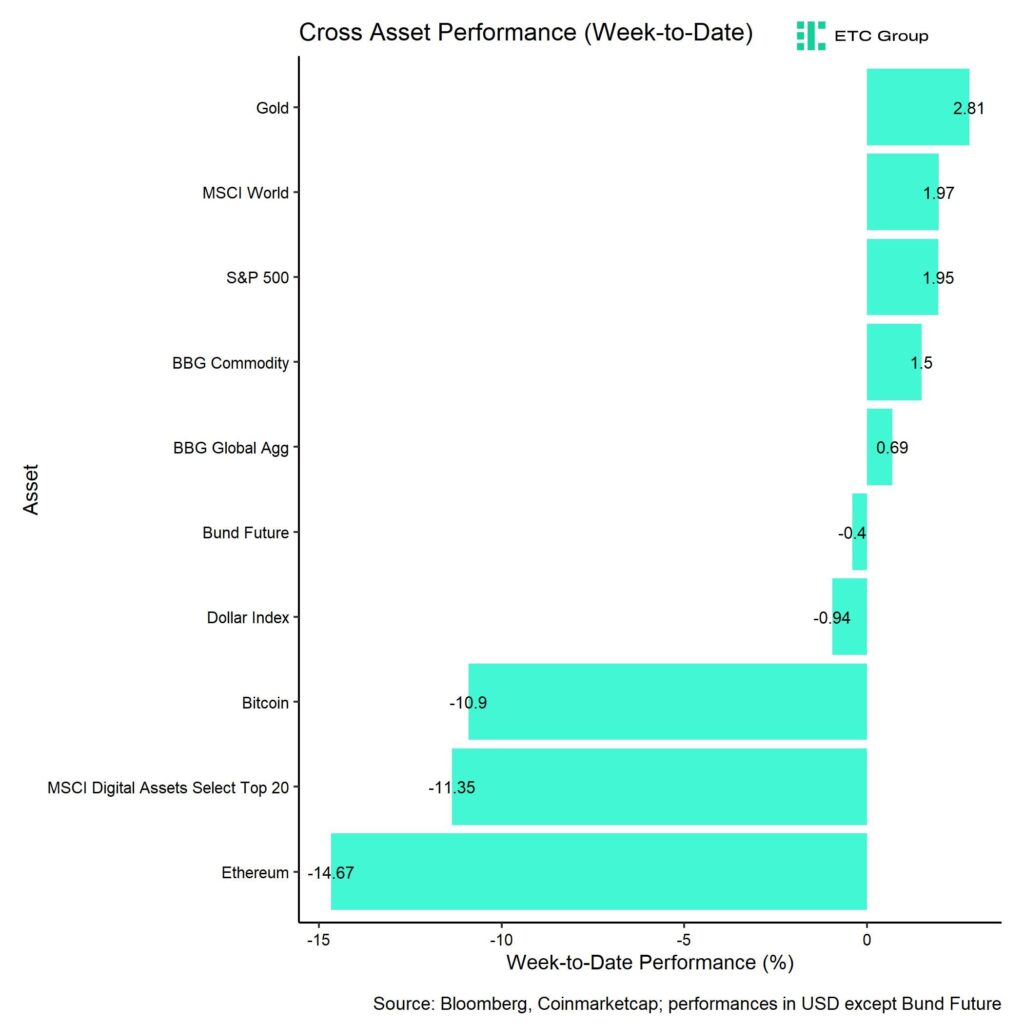
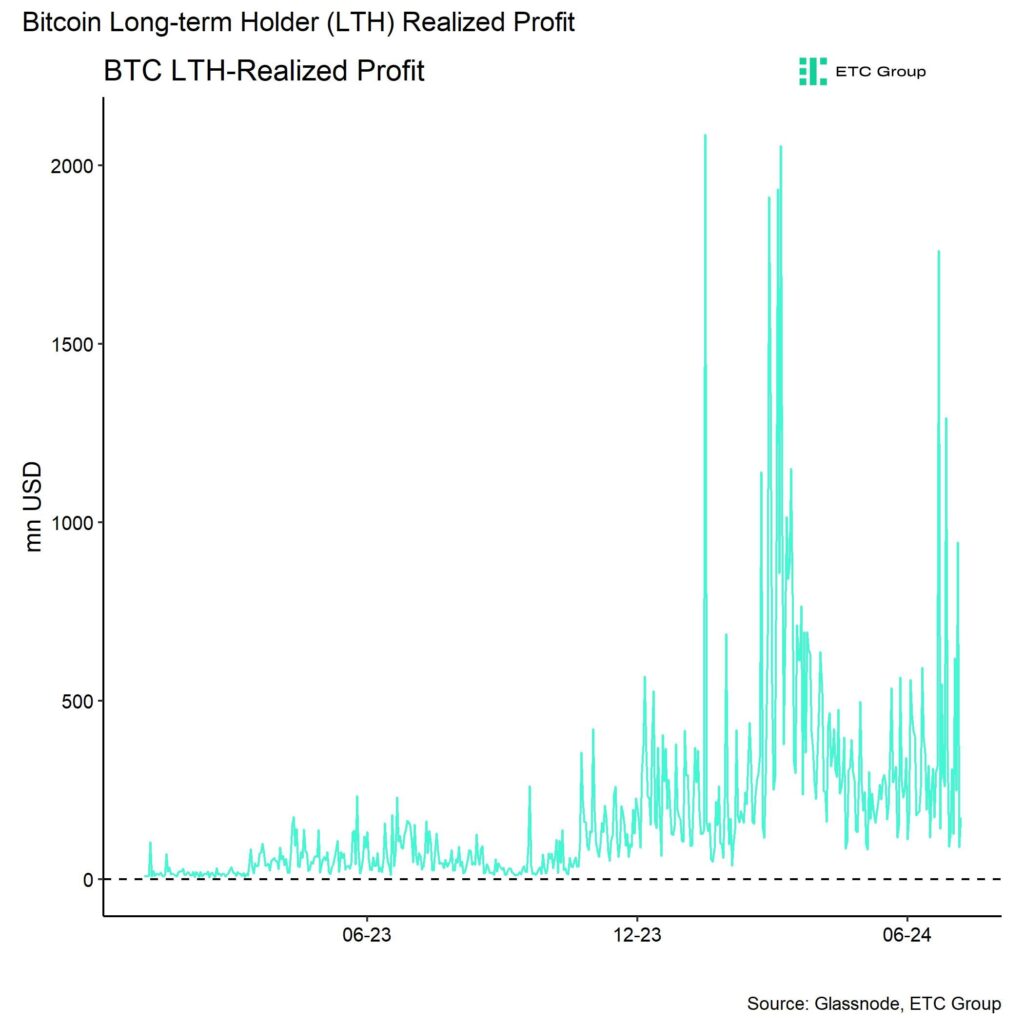
Last week, cryptoassets continued to underperform on account ongoing profit-taking by large long-term holders. This is also evident in the high readings of long-term holder’s (LTH) realized profits for Bitcoin (Chart-of-the-Week).
In this context, large long-term holders such as German government entities or the Mt Gox trustee continue to distribute their long-term holdings that they acquired many years back.
More recently, the Mt Gox trustee has also started distributing bitcoins. The trustee sold around 2.7k BTC on Friday alone last week. At the time of writing, the Mt Gox trustee still controls around 139k BTC according to data provided by Glassnode. Another major force of selling was the German government that sold around 6.4k BTC over the past week. This particular government entity still controls around 39.8k BTC.
Looking ahead, we still anticipate this amount of selling to continue to be a headwind for the overall market. In our latest monthly report we also wrote:
“Continued selling from US and German government entities could likely exert continued selling pressure on the market over the coming weeks.”
It may take time for the market to fully digest this level of selling, as opined by some influential market observers. This is due to the fact that much of the legacy supply that was accumulated by government entities (US and Germany), large trusts (GBTC) or legacy exchanges (Mt Gox) over the past years is currently being distributed again.
That being said, our Cryptoasset Sentiment Index has touched a fresh 2-months low again and is currently signalling relatively bearish sentiment and positioning again.
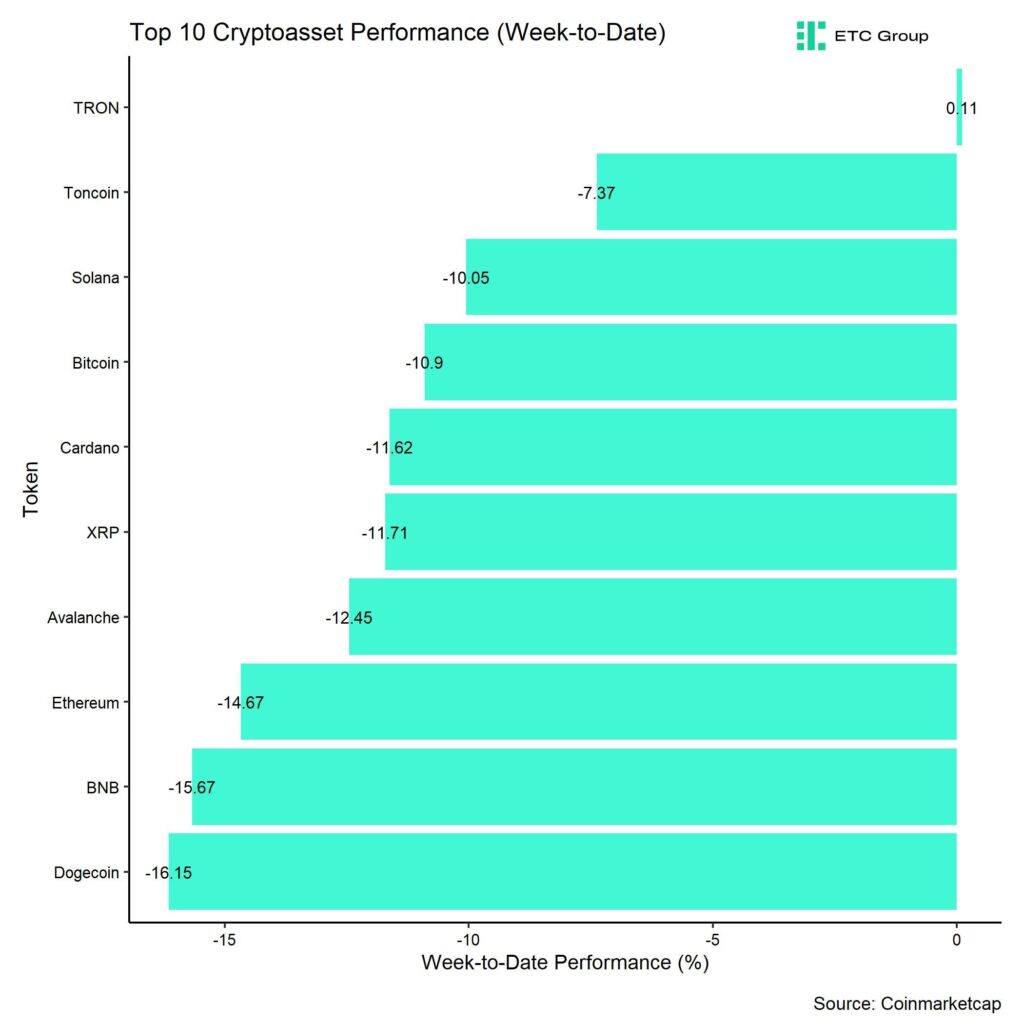
In general, among the top 10 crypto assets, TRON, Toncoin, and Solana were the relative outperformers.
Overall, altcoin outperformance vis-à-vis Bitcoin has significantly reversed again compared to the prior week, with only 20% of our tracked altcoins managing to outperform Bitcoin on a weekly basis. Ethereum also underperformed Bitcoin on a weekly basis.
Sentiment
Our in-house “Cryptoasset Sentiment Index” has declined sharply and signals a bearish sentiment again.
At the moment, only 5 out of 15 indicators are above their short-term trend.
Last week, there were significant reversals to the downside in the BTC Short-Term Holder Net Unrealized Profit/Loss ratio (STH-NUPL) and the Crypto Fear & Greed Index.
The Crypto Fear & Greed Index still signals a “Fear” level of sentiment as of this morning.
Performance dispersion among cryptoassets has reversed to the downside again. This means that altcoins are increasingly becoming correlated with the performance of Bitcoin again.
Altcoin outperformance vis-à-vis Bitcoin has also significantly reversed compared to the week prior, with only around 20% of our tracked altcoins outperforming Bitcoin on a weekly basis, which is consistent with the fact that Ethereum also underperformed Bitcoin last week.
In general, increasing (decreasing) altcoin outperformance tends to be a sign of increasing (decreasing) risk appetite within cryptoasset markets and the latest altcoin underperformance could signal declining appetite for risk at the moment.
In contrast, sentiment in traditional financial markets rebounded from its multi-year lows along with a rebound in market-based global growth expectations, judging by our own measure of Cross Asset Risk Appetite (CARA).
Fund Flows
Despite the weak price action last week, fund flows into global crypto ETPs continued to be positive and even started to accelerate again. Global crypto ETPs saw around +695.9 mn USD in net inflows across all types of cryptoassets which is significantly higher than the +38.2 mn USD in net inflows recorded the prior week.
Global Bitcoin ETPs saw net inflows of +632.7 mn USD last week, of which +238.5 mn USD in net inflows were related to US spot Bitcoin ETFs.
Last week also saw significant inflows into Hong Kong Bitcoin ETFs with +247.2 mn USD which was even slightly higher than US spot Bitcoin ETF net inflows.
Outflows from the ETC Group Physical Bitcoin ETP (BTCE) continued last week with net outflows equivalent to -42.0 mn USD while the ETC Group Core Bitcoin ETP (BTC1) saw neither in- nor outflows last week.
The Grayscale Bitcoin Trust (GBTC) continued to see net outflows, with around -87.9 mn USD last week.
Meanwhile, global Ethereum ETPs saw a reversal in flows last week compared to the week prior with positive net inflows totalling +7.7 mn USD. Interestingly, Hong Kong Ethereum ETFs neither recorded in- nor outflows last week (+/- 0 mn USD).
The ETC Group Physical Ethereum ETP (ZETH) saw minor net outflows of around -1.7 mn USD and the ETC Group Ethereum Staking ETP (ET32) showed sticky AuM last week (+/- 0 mn USD in flows).
In contrast, altcoin ETPs ex Ethereum continued to attract an even higher amount of capital of around +20.1 mn USD last week.
The same is true for Thematic & basket crypto ETPs which also continued to see positive net inflows of +35.4 mn USD, based on our calculations. The ETC Group MSCI Digital Assets Select 20 ETP (DA20) saw neither in- nor outflows last week.
Meanwhile, global crypto hedge funds have continued to increase their market exposure even further into the most recent correction. The 20-days rolling beta of global crypto hedge funds’ performance increased to around 0.66 (up from 0.57) per yesterday’s close.
On-Chain Data
Bitcoin on-chain data currently show a significant level of “pain” among short-term holders, which renders a short-term bottom very likely.
For instance, the short-term holder net unrealized profit-loss ratio (STH-NUPL) is currently at -14.6% meaning that the average short-term holder has around -14.6% in unrealized losses. This metric is already at the lowest level since November 2022 – when FTX collapsed!
Furthermore, the short-term holder spent output profit ratio (STH-SOPR) has declined to 0.957 last Friday – the lowest level since end of 2022 as well.
Short-term holders are investors with a holding period of less than 155 days.
At the time of writing, the average cost basis of short-term holders lies at around 64k USD per bitcoin according to data provided by Glassnode which means that short-term holders are significantly “under water” with their holdings. It is no surprise that short-term holders have continued to realize large amounts of losses into the most recent correction.
This seems to have exacerbated the most recent downside price correction.
That being said, profit-taking by long-term holders is currently the dominant force that is exerting selling pressure on the market.
This is also evident in the high levels of long-term holders’ (LTH) realised gains for bitcoin (Chart-of-the-Week).
In this context, large long-term holders such as the German government or the Mt Gox trustee continue to distribute their long-term holdings acquired many years ago.
Recently, the Mt. Gox trustee has also started to distribute bitcoins. On Friday of last week alone, the trustee sold around 2.7k BTC. At the time of writing, the Mt. Gox trustee still controls around 139k BTC, according to Glassnode. Another major selling force was the German government, which sold around 6.4k BTC last week. This particular government entity still controls around 39.8k BTC.
Looking ahead, we still anticipate this amount of selling to continue to be a headwind for the overall market as opined in our latest monthly report.
Besides, the hash ribbon signal also implies that BTC miners still remain under economic pressure which signals a heightened risk of continued distributions from these entities as well.
Moreover, the market lacks new catalysts that would lead to a significant influx of new short-term investors as shown by the Short- to Long-Term Realized Value (SLRV) Ribbon signal.
Despite the fact that we saw a positive reversal of global net inflows into Bitcoin ETPs over the past 2 weeks, net buying volumes on BTC spot exchanges continue to be negative, highlighting the high selling pressure from other types of investors.
On a positive note, this high degree of selling implies that sellers could become exhausted relatively soon, which would lead to a stabilization in prices.
Futures, Options & Perpetuals
Last week, both BTC futures and perpetual open interest declined amid an increase in forced long liquidations.
Nonetheless, perpetual funding rates mostly remained positive throughout last week. When the funding rate is positive (negative), long (short) positions periodically pay short (long) positions. A positive funding rate tends to be a sign of bullish sentiment in perpetual futures markets.
The 3-months annualized BTC futures basis rate declined significantly to only around 8.0% p.a.
BTC options’ open interest increased significantly last week after the large expiries at the end of June. This increase in open interest was largely driven by an increase
in relative put open interest consistent with the recent price correction as BTC option traders increased their downside bets/hedges. However, the aggregate put-call open interest ratio still remains significantly lower than during the highs observed in March.
That being said, both the spike in put-call volume ratios as well as 1-month 25-delta option skew signalled a significant increase in demand for downside protection.
BTC option implied volatilities have also increased slightly during the latest leg down. Implied volatilities of 1-month ATM Bitcoin options are currently at around 50.5% p.a. The term structure of volatility is also inverted now, with short-dated options trading at significantly higher implied volatilities than longer-dated options. This tends to be a sign of overextended bearishness in the options market.
Bottom Line
• Last week, cryptoassets continued to underperform on account ongoing profit-taking by large long-term holders
• Our in-house “Cryptoasset Sentiment Indicator” has declined sharply and signals bearish sentiment again
• Ongoing profit-taking by large long-term holders such as German government entities or the Mt Gox trustee will likely continue to be a headwind over the coming weeks
To read our Crypto Market Compass in full, please click the button below:

This is not investment advice. Capital at risk. Read the full disclaimer
© ETC Group 2019-2024 | All rights reserved


Stablecoins are digital currencies tied to assets like the U.S. dollar, offering the price stability needed for payments. They maintain their peg by being backed 1:1 by their underlying fiat currency, with issuers holding equivalent amounts in cash and cash equivalents, making stablecoins a digital representation of those reserves. Their market has doubled to over $235 billion, with daily usage nearly doubling in two years.
Why are stablecoins making headlines now?
Due to their clear product-market fit and growing mainstream adoption, stablecoins have become a top priority for regulation, with both industry leaders and policymakers calling for swift action.
On April 4, the Securities and Exchange Commission’s Division of Corporation Finance finally clarified that stablecoins are not securities if backed one-for-one by USD or similar assets and used for payments or value storage. These “Covered Stablecoins” are not marketed as investments, lack profit incentives, and include protections like reserves, making securities law registration unnecessary for issuance or redemption.
The GENIUS Act, introduced in February and advanced by the U.S. Senate Banking Committee in March, marks a major step toward creating a clear legal framework for stablecoin issuance and oversight. This clarity is driving momentum as Fidelity is set to launch its own stablecoin, and Bank of America is preparing to follow it once legislation is finalized.
Globally, the European Union’s Markets in Crypto Assets (MiCA) framework has already come into effect, reinforcing a broader shift toward formal integration of stablecoins into traditional finance. These developments reflect a growing consensus that stablecoins are emerging as essential infrastructure for global payments, treasury management, and digital asset adoption.
What are the benefits of stablecoins?
Stablecoins are digital currencies designed for fast, low-cost, and stable transactions. Since their launch in 2014, they’ve become a go-to tool for online payments, especially cross-border transfers. As they’re pegged to stable assets like the U.S. dollar or euro, they avoid the wild price swings seen in other cryptocurrencies.
They’re accessible to anyone with internet, making them especially valuable in regions with high inflation or limited banking access, like Argentina or Turkey.
With some built on public blockchains, stablecoins offer transparency, letting users track transfers and supply in real time. For institutions, they also simplify treasury management by acting as efficient digital cash that can be deployed instantly.
Who are the major players in the stablecoin race?
Tether (USDT) and Circle (USDC), the two largest stablecoin issuers, collectively hold over $204 billion in U.S. Treasuries, making them the 14th largest holders globally. Their combined treasury holdings surpass those of entire nations, including Norway and Brazil.
USDT leads with $144 billion in circulation; USDC, backed by Coinbase and known for compliance, has become a trusted digital dollar across global finance.
Why stablecoins matter: A revenue engine for blockchains
Stablecoins generate steady revenue for blockchains like Ethereum and Solana by driving transaction fees with each transfer. With trillions in annual volume, they help sustain network activity beyond speculation.
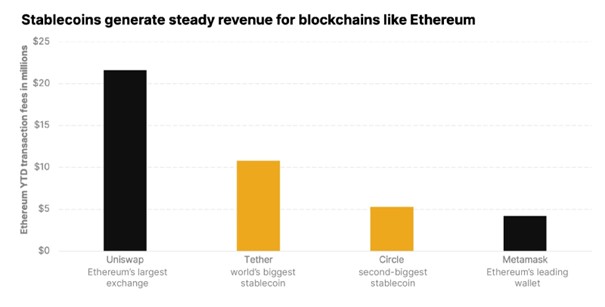
On Ethereum, for example, USDT and USDC transactions are major contributors to daily gas fees. Year to date, Tether ranks #3 and USDC ranks #5 in terms of total gas consumed. Tether and Circle also dominate daily transaction activity on Ethereum, averaging approximately 12 million and 6 million transactions per day, respectively, making them the top two entities on the network by daily transaction count.
Meanwhile, on Solana, stablecoin activity has surged, helping sustain validator rewards and strengthen protocol economics. In addition to the mainstream utility, stablecoins represent reliable, protocol-level cash flow, making them crypto’s killer use case.
Research Newsletter
Each week the 21Shares Research team will publish our data-driven insights into the crypto asset world through this newsletter. Please direct any comments, questions, and words of feedback to research@21shares.com
Disclaimer
The information provided does not constitute a prospectus or other offering material and does not contain or constitute an offer to sell or a solicitation of any offer to buy securities in any jurisdiction. Some of the information published herein may contain forward-looking statements. Readers are cautioned that any such forward-looking statements are not guarantees of future performance and involve risks and uncertainties and that actual results may differ materially from those in the forward-looking statements as a result of various factors. The information contained herein may not be considered as economic, legal, tax or other advice and users are cautioned to base investment decisions or other decisions solely on the content hereof.


VSUI ETN spårar priset på kryptovalutan SUI

Stablecoins: The real powerhouse of crypto

BE29 ETF är en portfölj företagsobligationer med förfall 2029

Guld-ETFer slår Bitcoin-ETFer kraftigt under första kvartalet 2025

INGH ETF är en satsning på global infrastruktur

Fonder som ger exponering mot försvarsindustrin
Crypto Market Risks & Opportunities: Insights on Bybit Hack, Bitcoin, and Institutional Adoption

Montrose storsatsning på ETFer fortsätter – lanserar Sveriges första globala ETF med hävstång

Warren Buffetts råd om vad man ska göra när börsen kraschar

Svenskarna har en ny favorit-ETF
-
 Nyheter4 veckor sedan
Fonder som ger exponering mot försvarsindustrin
-

 Nyheter3 veckor sedan
Crypto Market Risks & Opportunities: Insights on Bybit Hack, Bitcoin, and Institutional Adoption
-
 Nyheter2 veckor sedan
Montrose storsatsning på ETFer fortsätter – lanserar Sveriges första globala ETF med hävstång
-
 Nyheter4 veckor sedan
Warren Buffetts råd om vad man ska göra när börsen kraschar
-
 Nyheter3 veckor sedan
Svenskarna har en ny favorit-ETF
-

 Nyheter2 veckor sedan
MONTLEV, Sveriges första globala ETF med hävstång
-

 Nyheter4 veckor sedan
Fastställd utdelning i MONTDIV mars 2025
-

 Nyheter2 veckor sedan
Sju börshandlade fonder som investerar i försvarssektorn