
Nyheter
Crypto Market Compass 10 June 2024
• Last week, cryptoassets outperformed traditional assets due to a reacceleration in US spot Bitcoin ETF inflows
• Our in-house “Cryptoasset Sentiment Indicator” continues to fluctuate around neutral levels of sentiment
• US spot Bitcoin ETFs saw their highest weekly net inflow since mid-March and have seen 20 consecutive trading days of positive net inflows so far
Chart of the Week
Performance
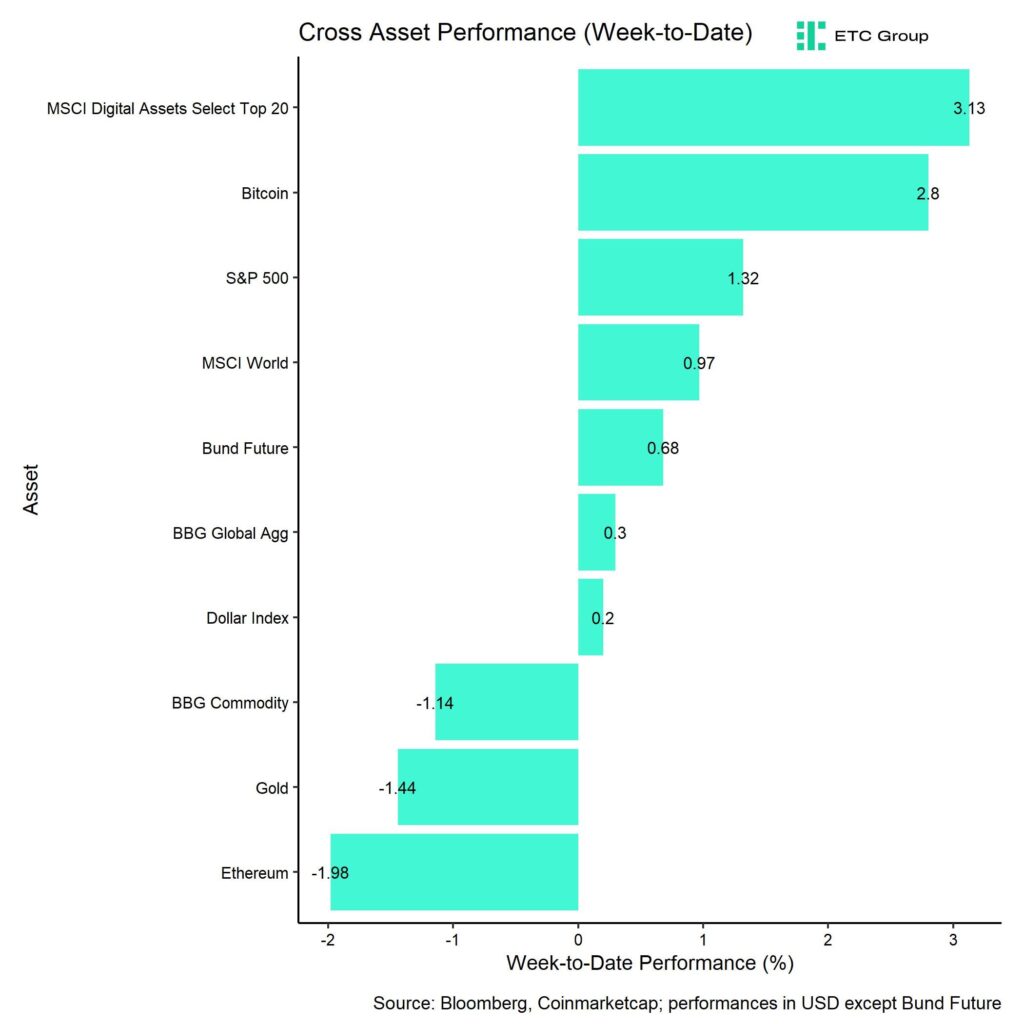
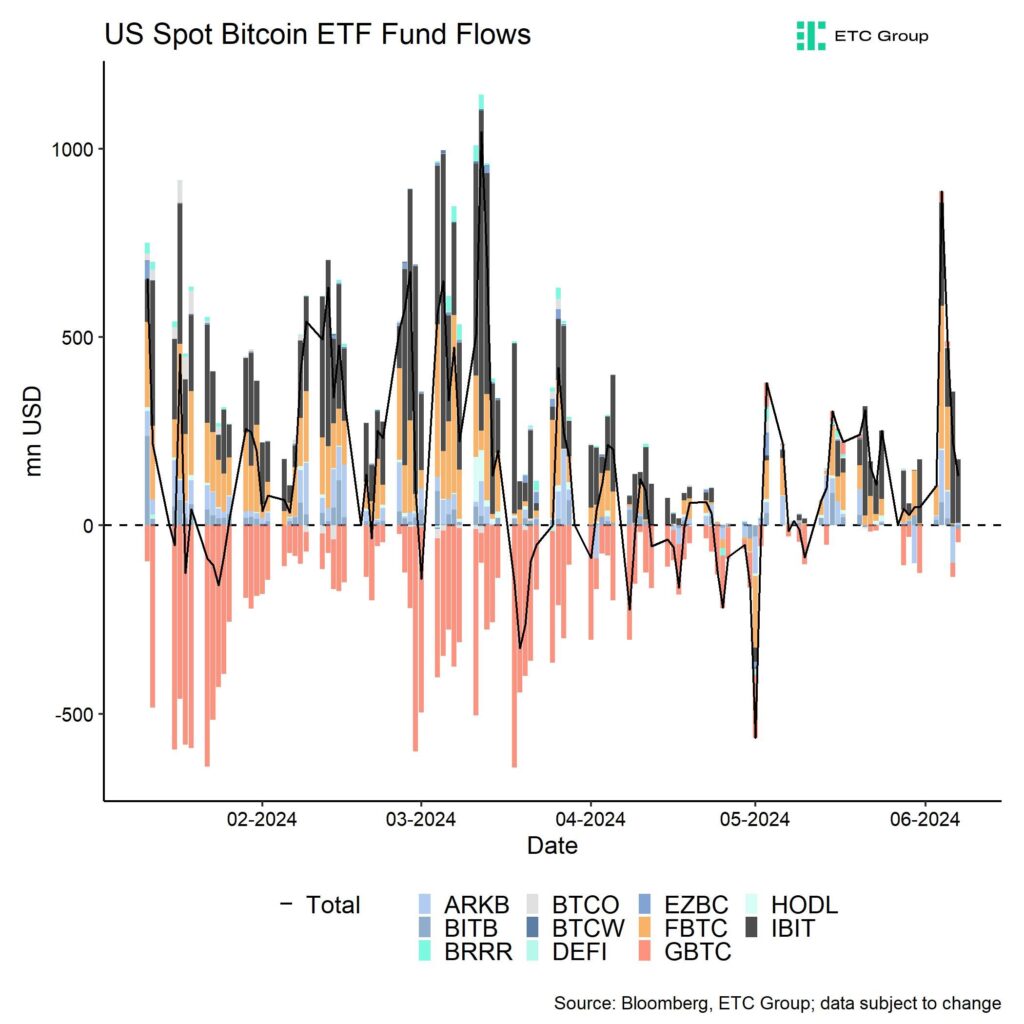
Last week, cryptoassets outperformed traditional assets once again supported by a renewed acceleration in global crypto ETP net inflows and US spot Bitcoin ETF net inflows in particular.
More specifically, US spot Bitcoin ETFs saw their highest weekly net inflow since mid-March (Chart-of-the-Week). Weekly crypto ETP net inflows across all types of cryptoassets surpassed 2 bn USD last week, of which net inflows into US spot Bitcoin ETFs accounted for ~80.5% alone. US spot Bitcoin ETFs have seen 20 consecutive trading days of positive net inflows so far.
It seems as if risk appetite is returning to the crypto markets, especially after the ECB and Bank of Canada both announced to cut their key interest rates last week. These developments mark a significant shift in major central banks’ monetary policy as these are the first interest rate cuts since 2019 (ECB) and 2020 (Bank of Canada), respectively.
The macro liquidity tide is obviously turning already, which we have also analysed in our latest monthly report here.
However, the net implications for Bitcoin and cryptoassets of this reversal in global monetary policy are still somewhat mixed as these changes also signal that economic data are worsening significantly and global growth still seems to be the most dominant macro factor for Bitcoin at the moment based on our analyses.
In this context, the latest non-farm payrolls print that came in way above expectations seems to be inconsistent with other US employment data that continue to signal worsening labour market conditions.
That being said, over the medium- to long-term, monetary policy easing will provide a significant tailwind for Bitcoin and cryptoassets, especially in light of the latest Bitcoin Halving that will probably affect performances positively from summer onwards.
Increasing spot supply scarcity is generally visible for both Bitcoin and Ethereum as on-exchange balances continue to hit multi-year lows.
So, while the growth of fiat liquidity supply is likely to accelerate over the next 12 months, the illiquidity of supply of major cryptoassets such as Bitcoin and Ethereum will also worsen.
This combination of fiat demand expansion and cryptoasseet supply tightening is bound to be very positive for cryptoassets going forward.
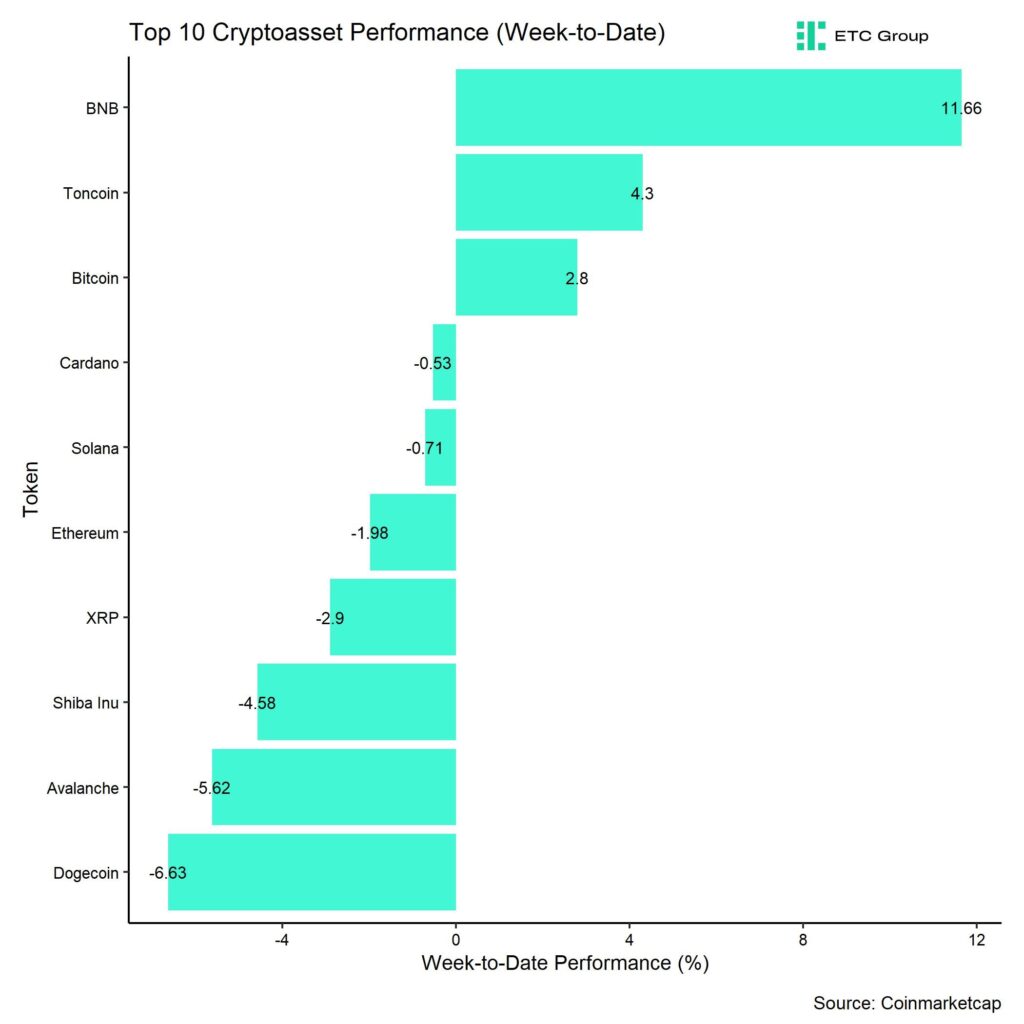
In general, among the top 10 crypto assets, BNB, Toncoin, and Bitcoin were the relative outperformers.
Overall, altcoin outperformance vis-à-vis Bitcoin has declined significantly compared to the prior week, with only around 15% of our tracked altcoins managing to outperform Bitcoin on a weekly basis. This is consistent with the fact that Bitcoin outperformed Ethereum by almost 500 bps last week, which is generally a sentiment gauge for the overall altcoin market.
Sentiment
Our in-house “Cryptoasset Sentiment Index” continues to fluctuate around neutral levels of sentiment.
At the moment, 5 out of 15 indicators are above their short-term trend.
Last week, there were significant reversals to the upside in BTC exchange inflows and BTC options put-call volume ratios.
The Crypto Fear & Greed Index signals ”Greed” as of this morning.
Performance dispersion among cryptoassets still remains very low. Most altcoins are still trading in line with Bitcoin.
Altcoin outperformance vis-à-vis Bitcoin has declined significantly compared to the week prior, with only around 15% of our tracked altcoins outperforming Bitcoin on a weekly basis, which is consistent with the fact that Bitcoin outperformed Ethereum last week.
In general, increasing (decreasing) altcoin outperformance tends to be a sign of increasing (decreasing) risk appetite within cryptoasset markets and the latest altcoin underperformance could signal low appetite for risk at the moment.
Meanwhile, sentiment in traditional financial markets rebounded to the upside from its recent lows, judging by our own measure of Cross Asset Risk Appetite (CARA).
Fund Flows
Last week, we saw very positive net inflows into global crypto ETPs of around +2,270.4 mn USD which was the highest amount of weekly net inflows since mid-March.
Global Bitcoin ETPs saw net inflows of +2,189.0 mn USD last week, of which +1,828.9 mn USD (net) were related to US spot Bitcoin ETFs alone. US spot
Bitcoin ETFs have seen 20 consecutive trading days of positive net inflows so far.
Flows into Hong Kong spot Bitcoin ETFs were also decent, with net inflows of around +260.6 mn USD, according to data provided by Bloomberg.
The ETC Group Physical Bitcoin ETP (BTCE) saw minor net outflows equivalent to -5.3 mn USD while the ETC Group Core Bitcoin ETP (BTC1) saw no net flows (+/- 0 mn USD) last week.
The Grayscale Bitcoin Trust (GBTC) continued to see minor net outflows with approximately -31.1 mn USD last week, while other major US spot Bitcoin ETFs continued to attract more capital.
Global Ethereum ETPs saw accelerating net inflows last week, with net inflows of around +80.0 mn USD.
Furthermore, the ETC Group Physical Ethereum ETP (ZETH) saw another week of net inflows of +1.5 mn USD last week. The ETC Group Ethereum Staking ETP (ET32) saw neither in- nor outflows last week (+/- 0 mn USD).
Besides, Altcoin ETPs ex Ethereum also experienced some minor net inflows of around +17.8 mn USD last week.
Besides, Thematic & basket crypto ETPs continue to see minor net outflows of -7.5 mn USD, based on our calculations. The ETC Group MSCI Digital Assets Select 20 ETP (DA20) saw neither in- nor outflows last week (+/- 0 mn USD).
Meanwhile, global crypto hedge funds continue to decrease their market exposure to Bitcoin. The beta of global crypto hedge funds’ performance has declined to 0.73 over the past 20 trading days.
On-Chain Data
Looking at core on-chain data for Bitcoin, we can make the following observations.
Active addresses still hover near year-to-lows as transaction fees remain relatively high. There was also a spike in mean transaction fees last week on Friday to the highest level since the Halving event on the 20th of April. The mean transaction fee reached 83.7 USD that day.
One of the reasons is that the overall number of transactions and also the transaction rate (transactions/second) have gradually increased over the past weeks which has resulted in an increase in the mempool of unconfirmed transactions.
This does not seem to be inscription-related, as this share has remained below 10% of overall transaction count.
The Bitcoin hash rate also continued to be relatively high and we even saw a slight increase in network hash rate compared to the prior week. In this context, there are still no signs of “miner capitulation” in light of the recent reduction of mining revenues due to the Halving. For instance, aggregate BTC miner balances have moved sideways and we haven’t seen significant miner transfers to exchanges either.
Looking at exchange activity, one can observe say that exchange balances continue to decline to fresh multi-year lows. For instance, aggregate BTC exchange balances have touched the lowest level since March 2018 and aggregate ETH exchange balances touched the lowest level since July 2016 last week.
Bitcoin exchanges saw around -21.7k BTC in net withdrawals over the past 7 days and whales have continued to send bitcoins of exchange as well. Whales are defined as network entities that control at least 1,000 BTC.
However, net buying minus selling volumes on exchanges have been negative over the past week, despite significant net inflows into spot US Bitcoin ETFs. This implies that there is significant selling pressure on spot exchanges that is countering current buying demand.
This is probably one of the main reasons why bitcoin has not reclaimed new all-time highs despite reaccelerating US spot Bitcoin ETF inflows.
Futures, Options & Perpetuals
Last week, BTC futures open interest increased significantly and reached the highest level since January 2023 in BTC-terms. Perpetual open interest also reached the highest level since December 2023 in BTC-terms. The significant increase futures open interest was only partially attributed to an increase in CME futures open interest that accounted for less than half of this increase. However, the CME data point to a significant increase in net short open interest by non-commercials.
This is probably due to the fact that the Bitcoin futures basis continued to creep upwards and has reached a 2-months high of around 14.2% p.a. This has probably attracted more basis trades, which has resulted in the abovementioned increase in short open interest. The basis trade consists of a delta-neutral long and short position in Bitcoin.
Meanwhile, perpetual funding rates continued to be relatively elevated, signalling decent demand for long perpetual contracts.
Bitcoin options’ open interest also increased significantly last week. The decline in relative put-call open interest ratio implies that this increase was mostly driven by an increase in call open interest on a net basis. A call option gives the holder the right to buy the underlying at a specific price in the future. Relative put-call volume ratios declined throughout the week.
The decline in the 25-delta BTC 1-month option skew also corroborates the view that there was increased demand for calls relative to puts.
BTC option implied volatilities also continued to decrease last week. Implied volatilities of 1-month ATM Bitcoin options are currently at around 49.8% p.a.
Bottom Line
• Last week, cryptoassets outperformed traditional assets due to a reacceleration in US spot Bitcoin ETF inflows
• Our in-house “Cryptoasset Sentiment Indicator” continues to fluctuate around neutral levels of sentiment
• US spot Bitcoin ETFs saw their highest weekly net inflow since mid-March and have seen 20 consecutive trading days of positive net inflows so far
To read our Crypto Market Compass in full, please click the button below:

This is not investment advice. Capital at risk. Read the full disclaimer
© ETC Group 2019-2024 | All rights reserved


- Trump’s crypto ally now leads the SEC, signaling the potential for a pro-crypto agenda
- Bitcoin isn’t just for HODLing anymore, thanks to Babylon
- The Dogecoin story: The emerging “intrinsic value”
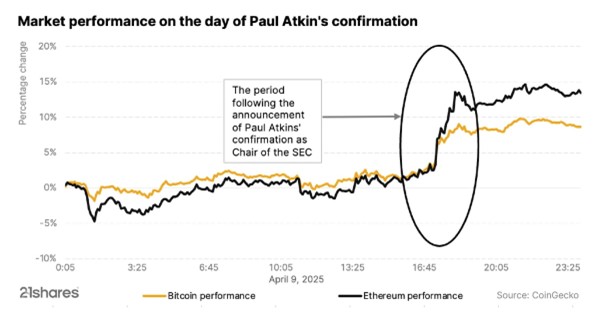
Trump’s crypto ally now leads the SEC, signaling the potential for a pro-crypto agenda
Paul Atkins’ appointment as SEC Chair marks a significant turning point for cryptocurrency regulation in the United States. The cryptocurrency market embraced him, with both Bitcoin and Ethereum rallying up to 9% and 14% respectively in the immediate aftermath. Given Atkins’ background in the crypto space, the industry has welcomed his confirmation and anticipates that he may expedite the approval of several pending projects.

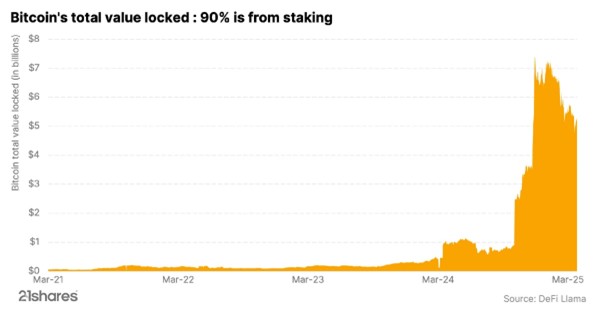
Bitcoin isn’t just for HODLing anymore, thanks to Babylon
Bitcoin is known for being one of the most secure blockchains out there. Now, a new project called Babylon is making waves by tapping into Bitcoin’s rock-solid security and bringing the staking feature to the Bitcoin world. Learn more about Bitcoin staking and its importance.


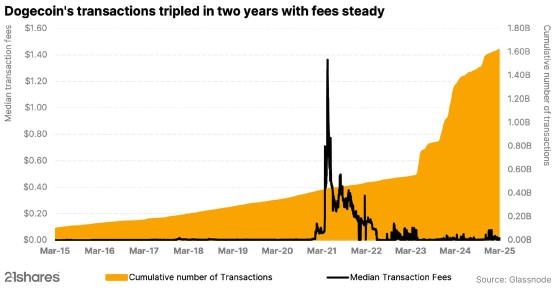
The Dogecoin story: The emerging “intrinsic value”
Dogecoin may have started as a meme, but it’s now a serious player in digital payments, offering fast, low-cost transactions to a passionate community driving real-world impact and innovation. The chart below underscores that real-world usage: it shows that cumulative transactions on the Dogecoin blockchain have surged over the past two years, effectively tripling in volume, all while transaction costs have remained remarkably low.

Research Newsletter
Each week the 21Shares Research team will publish our data-driven insights into the crypto asset world through this newsletter. Please direct any comments, questions, and words of feedback to research@21shares.com
Disclaimer
The information provided does not constitute a prospectus or other offering material and does not contain or constitute an offer to sell or a solicitation of any offer to buy securities in any jurisdiction. Some of the information published herein may contain forward-looking statements. Readers are cautioned that any such forward-looking statements are not guarantees of future performance and involve risks and uncertainties and that actual results may differ materially from those in the forward-looking statements as a result of various factors. The information contained herein may not be considered as economic, legal, tax or other advice and users are cautioned to base investment decisions or other decisions solely on the content hereof.


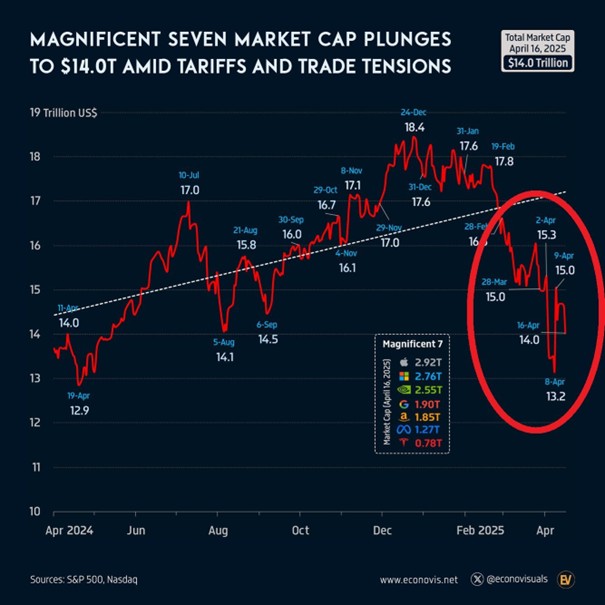
De amerikanska aktier som kollektivt går under namnet Mag7, också kända som Magnificent 7 aktierna har förlorat 4,4 biljoner dollar i marknadsvärde sedan toppen i december.
Detta är nästan dubbelt så mycket som värdet på den tyska aktiemarknaden. Dessa aktier återspeglar ~29 % av S&P 500-börsvärdet, en minskning från rekordhöga 34 %.
Vi skrev nyligen en artikel om tyska utdelningsaktier som du finner här
För den som letar efter investeringar i Tyskland klicka här
Källa: Global Markets Investor @GlobalMktObserv

A pro-crypto agenda is underway

SPFS ETF investerar i globala hälsovårdsföretag

Slakten av Magnificent 7 aktierna

RMPH ETC Ansvarsfullt fysiskt guld med GBP-säkring

Gold’s rally may signal what’s ahead for BTC
Crypto Market Risks & Opportunities: Insights on Bybit Hack, Bitcoin, and Institutional Adoption

Montrose storsatsning på ETFer fortsätter – lanserar Sveriges första globala ETF med hävstång

Warren Buffetts råd om vad man ska göra när börsen kraschar

Svenskarna har en ny favorit-ETF

MONTLEV, Sveriges första globala ETF med hävstång
-

 Nyheter3 veckor sedan
Crypto Market Risks & Opportunities: Insights on Bybit Hack, Bitcoin, and Institutional Adoption
-
 Nyheter3 veckor sedan
Montrose storsatsning på ETFer fortsätter – lanserar Sveriges första globala ETF med hävstång
-
 Nyheter4 veckor sedan
Warren Buffetts råd om vad man ska göra när börsen kraschar
-
 Nyheter3 veckor sedan
Svenskarna har en ny favorit-ETF
-
 Nyheter3 veckor sedan
MONTLEV, Sveriges första globala ETF med hävstång
-

 Nyheter4 veckor sedan
Fastställd utdelning i MONTDIV mars 2025
-

 Nyheter2 veckor sedan
Sju börshandlade fonder som investerar i försvarssektorn
-

 Nyheter2 veckor sedan
Världens första europeiska försvars-ETF från ett europeiskt ETF-företag lanseras på Xetra och Euronext Paris