
Nyheter
Coking Coal Rally Driven by Supply Constraints
Overview: VanEck’s natural resources investment strategy spans the breadth of raw materials commodities sectors, and the coal and consumable fuels sub-sector can play an important role. Not least, the global steel industry is dependent on coal. Metallurgical coal is essential to the steel making process with approximately 70% of the steel produced today using coal as a primary raw material. Metallurgic coal is also called “coking” coal because it is used to create coke, an irreplaceable input for steel production. Coking Coal Rally Driven by Supply Constraints
By the end of September, metallurgical coal prices had climbed more than 100% since the beginning of the year.1 The overwhelming driver behind this price recovery has been restriction in supply. In addition to both lower seaborne and domestic supply, inventories are also at multi-year lows. Although our view is that current prices are not likely to hold, we do foresee a continuation of a market environment that will be supportive of higher prices.
What is Metallurgical Coal?
Global steel production depends on coal. Metallurgical coal, or coking coal, is used in the process of making steel, and hence is often referred to as “steel making coal”. Coking coal is heated to about 2,700° F (1,100° C) in a coke oven, forcing out impurities to produce coke. Coke itself is almost pure carbon. Because of its high thermal energy and dearth of impurities, coke is used to convert iron ore into molten iron. This is then used to make a range of steel types.
Global Demand is Solid
Over the past three years, global demand for coking coal has been relatively solid at an annual level of around 990 million tonnes (Mt). China is one of the most important consumers in terms of setting prices, since it accounts for approximately 60%, or 590Mt, of global coking coal demand. It is followed by Japan at 69Mt, India at 49Mt, and South Korea at 40Mt. Demand from the U.S. is for about 21Mt per annum.
China has invested heavily in its steel industry and currently accounts for approximately 55% of the world’s steel production. The net result of this is that domestic Chinese coking coal supply has had to be supplemented by imported, or seaborne coal (Chart A). “Seaborne” refers to coal that is transported internationally overseas by ship, and refers mostly to the coking coal export market.
Chart A: Chinese Seaborne Coking Coal Demand and Steel Production
Yearly in Tonnes: 2000-2016

(click to enlarge)
Source: VanEck, Bloomberg, World Steel Association, Australian Bureau of Statistic, Statistics Canada, and Chinese General Administration of Customs, as of 9/30/16.
Coking Coal Supply: The Seaborne Market and the Domestic Market
The global coking coal market is generally considered as being split between the seaborne (or export market) and the domestically traded market.
The Seaborne Market
The size of the global seaborne coking coal market was approximately 290Mt as of 2015 (Chart B). Despite being a much smaller market than the domestically traded coal market, the seaborne market is actively traded and, therefore, regarded as the price/trend indicator for all contracts.
Australia, the U.S., and Canada are the key suppliers of coking coal to the seaborne market. Seaborne supply reached record levels in 2014 as shown in Chart B. However, supply fell 8% in 2015 as producer profitability decreased, balance sheet quality deteriorated, and capital spending contracted. In 2016, supply has collapsed even more dramatically, and on an annualized basis, 2016 seaborne supply could be as low as 185Mt, or down 37%, a level last seen in 2004.
Chart B: Global Seaborne Coking Coal Supply
Yearly in Tonnes: 2000-2016

(click to enlarge)
Source: VanEck, Bloomberg, Australian Bureau of Statistic, Statistics Canada, Chinese General Administration of Customs, and U.S. Census Bureau, as of 9/30/16.
The U.S. has had the largest impact on the shrinking supply to the seaborne market. Over the past three years, U.S. coking coal exports have fallen consistently, driven by subdued prices, lower margins, and/or restrictive environmental policies (Chart C). U.S. exports peaked at about 70Mt in 2012, but since then they have contracted by nearly 42% and 2016 exports are estimated at 40Mt. The export decline has been particularly pronounced over the past twelve months, a period in which 20Mt in capacity was lost.
Chart C: U.S. Coking Coal Exports
Quarterly in Tonnes: 2000-2016

(click to enlarge)
Source: VanEck, Bloomberg, and U.S. Energy Information Administration, as of 9/30/16.
The Domestic Market
Domestic coking coal markets have also seen a dramatic reduction in supply. In 2016, China made a fundamental shift and implemented supply-side reforms in the domestic coal industry to curb overcapacity. In short, the reforms reduced the number of statutory working days for coal miners from 330 to 276. By mid-2016, in China, year-on-year production was down 20%, and in the coking coal-rich Shanxi province it was down 25% to 30%. As a result, because of lower supply and relatively solid demand, coking coal inventories in China are currently at multi-year lows.
Our Positive Outlook for Coking Coal
Current physical market conditions remain very tight. We believe that just as low prices have resulted in reduced supply, higher prices should lead to increased supply. At current spot market prices, virtually every tonne of seaborne coking coal will be cash positive.
While we do not expect current prices to hold, we do foresee a strong and supportive market that will keep prices higher than the current contract price (around $92.50 per tonne). This outlook is supported by a number of different factors. In addition to the fact that 70% of deals are executed by coking coal end-users and not traders, some 80% of concluded transactions were in Asia. On top of this, not only are coking coal inventories at coke plants at their lowest levels on record, demand for steel is also expected to remain solid. Taken together, we believe these factors provide a solid base for firm prices going forward.
AUTHORED BY

Charl Malan
Senior Analyst
________________________________________
Senior Analyst for the Natural Resources Equity strategy; specializes in Base and Industrial Metals; also serves on the investment team for the Gold Equity strategy
Investment Management Team member since 2003
Prior to joining VanEck, an equity research sales analyst specializing in South African mining, natural resources, and financial sectors at JPMorgan Chase; actively involved in the merger of BHP Billiton/SAB Miller and unbundling of Iscor Steel/Kumba Resources as well as capital raisings and NYSE listing of Harmony Gold, Gold Fields, and Telkom SA
Previously an equity research analyst and junior portfolio manager at Standard Corporate and Merchant Bank, Asset Management (South Africa); developed and applied various fundamental and quantitative models within the natural resources, mining, and consumer sectors; established an equity research department and managed Standard Corporate and Merchant Bank, Asset Management (Namibia)
Media appearances include ROBTv; quoted in The Wall Street Journal, Barron’s, Forbes, CNBC, and The Financial Times, among others; also featured in mining journals such as miningmx, Mining Journal, and Resource Investor
MBA, University of Stellenbosch (South Africa); Honours in Business Administration, University of Stellenbosch (South Africa); BA, Arts, University of Pretoria (South Africa)
IMPORTANT DISCLOSURE
1 Source: Bloomberg. Data as of 9/30/16 is based on the TSIPPCAE Index: Premium Hard Coking Coal Australia Export (FOB East Coast port) USD/tonne. This price index is compiled by The Steel Index Ltd (TSI), and it represents the volume-weighted average of actual transaction price data submitted confidentially online to TSI by companies operating within the relevant supply chain, including buyers and sellers, based on their latest sales and/or purchases within this product category. An index’s performance is not illustrative of a Fund or strategy’s performance. Indices are not securities in which investments can be made.


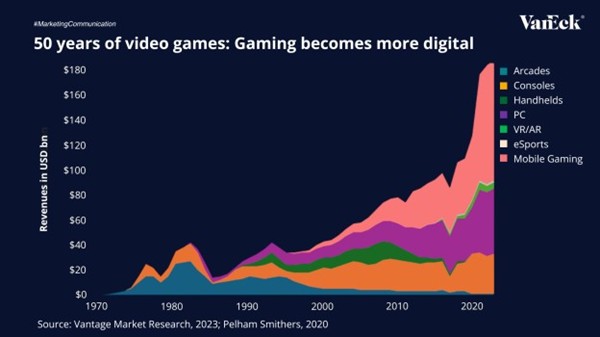
The global gaming industry has evolved into one of the world’s most dynamic entertainment sectors, expected to generate $188.9 billion in 2024 and surpass $200 billion by 2027, outpacing film and music combined.
From arcades to smartphones, the gaming industry has continuously evolved with each technological shift. Today, mobile gaming is a major player the market, currently accounting for the largest share of global revenues. As digital platforms, cloud gaming, and eSports continue to grow, gaming is establishing itself as a core part of the global entertainment economy.
Mobile gaming is leading this transformation, currently accounting for the majority of industry revenues and 40% of all global app downloads. With 5G adoption and 90% smartphone penetration expected by 2030, billions of new players will join the market, making gaming more accessible than ever.
However, the rollout of 5G also carries risks, uneven global infrastructure buildout, high capital costs for carriers, and potential fragmentation across networks could delay or limit the full realization of these benefits.
Source: Vantage Market Research, 2023; Pelham Smithers, 2020
To receive more Gold Investing insights, sign up to our newsletter.
IMPORTANT INFORMATION
This is marketing communication. Please refer to the prospectus of the UCITS and to the KID/KIID before making any final investment decisions. These documents are available in English and the KIDs/KIIDs in local languages and can be obtained free of charge at www.vaneck.com, from VanEck Asset Management B.V. (the “Management Company”) or, where applicable, from the relevant appointed facility agent for your country.


Is Mobile Powering the Future of Gaming?

Fyra nya börshandlade fonder från JP Morgan

AIFS ETF en satsning på infrastruktur för artificiell intelligens

J.P. Morgan Asset Management utökar sitt erbjudande med två nya aktiva ETFer

ISRU ETF köper aktier i stora amerikanska företag

HANetf och Infrastructure Capital Advisors samarbetar för att lansera aktivt förvaltad preferensavkastnings-ETF i Europa

De bästa lågvolatilitets ETFer på marknaden
Time in Bitcoin beats timing Bitcoin

Fokus mot en helt ny börshandlad produkt i september 2025

HANetf kommenterar kopparuppgången
-
 Nyheter4 veckor sedan
HANetf och Infrastructure Capital Advisors samarbetar för att lansera aktivt förvaltad preferensavkastnings-ETF i Europa
-
 Nyheter4 veckor sedan
De bästa lågvolatilitets ETFer på marknaden
-

 Nyheter4 veckor sedan
Time in Bitcoin beats timing Bitcoin
-
 Nyheter2 veckor sedan
Fokus mot en helt ny börshandlad produkt i september 2025
-
 Nyheter4 veckor sedan
HANetf kommenterar kopparuppgången
-

 Nyheter3 veckor sedan
M5TYs senaste utdelningstakt (55 %) belyser covered call-strategins inkomstpotential
-

 Nyheter3 veckor sedan
Börshandlade fonder för europeiska small caps
-

 Nyheter3 veckor sedan
Could Bitcoin be the key to your dream house?