Följ oss

Nyheter

Coffee offers upside potential in a depressed soft commodity market

Publicerad

den

Coffee offers upside potential in a depressed soft commodity market Soft commodities are skirting close to their decade-lows set in 2015

ETF Securities Commodity Research – Coffee offers upside potential in a depressed soft commodity market

Summary

  • Soft commodities are skirting close to their decade-lows set in 2015
  • Apart from Arabica coffee, softs are likely to remain in the doldrums
  • Cane sugar production is high and competition from EU beet sugar will intensify
  • In the absence of a meaningful weather disruption, cocoa production will remain strong

Arabica coffee

Brazil – which accounts for about 45% of global Arabica coffee output – has just completed its 2017/18 harvest. While output was always expected to be lower than last year due to the biennial cycles present in the country, production fell significantly short due to poor weather. Output is likely to be more than 20% below 2016/17 for Brazil (-9 million 60kg bags). Hopes for a rebound in the 2018/19 coffee crop in Brazil have become dimmer as a lack of rain has hampered the flowering of coffee bushes. Although rain has now commenced, it is late and development of new nodes on coffee bushes are likely to remain inadequate.

Mexico and Central America (20% of global production) have commenced their 2017/18 harvest. So far the output from the region looks strong and we could see a 1 million bag increase in production (6%). Production in Mexico Honduras and Nicaragua seems to have improved after years of coffee leaf rust problems, although El Salvador, Guatemala, and Costa Rica are still suffering from this fungus which reduces coffee yields.

Colombia (15% of global production) is likely remain close to last year’s levels which was at a decade high. There has been 30% growth in Colombian production over the past 10 years.

Despite strong production elsewhere, a decline in Brazilian output and weakening prospects for the country this year could act as a catalyst for prices. While in previous years, Brazil has been able to sell abundant stocks from prior years during poor harvests, its stocks have fallen significantly and supply tightness will likely be felt this year.

Brazil: September 2017 rainfall (departure from average 1961-1990 levels)
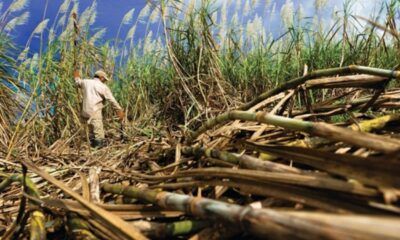
Sugar

We are likely to end two years of supply deficits this year. Brazil, the largest producer of cane (22% of global production) has seen close to 6% year on year growth in sugar production in the season so far. It’s not that more sugar cane has been cultivated this year, but that more cane has been diverted to sugar production instead of ethanol production. With oil prices trading below US$60/bbl we are unlikely to see a pickup in ethanol production (ethanol is an alternative car fuel in Brazil).

India, the second largest producer of cane sugar (15%) has received heavy rainfall in recent weeks, helping to fill its reservoirs. Although the monsoon rains appeared to have slowed prematurely several weeks ago, rain came back vigorously, leaving the season’s rainfall close to normal levels. Both the area of planting and sugar yield are expected to rise increasing production by more than 15%.

Thailand, has also experienced a good monsoon season which will help it raise its cane sugar production by over 10%.

The European Union is a producer of beet sugar rather than cane sugar. However, the abolition of production and export quotas from the EU this month will mean that there will be more beet sugar available to compete with cane sugar. The EU projects that by 2026 EU sugar production will rise by 6% over 2016 levels. That appears to be an overly conservative estimate. The USDA’s EU office projects EU sugar production to rise 20% in 2017/18 alone, surpassing the 2014/15 high, while exports will rise by a third.

Under such strong supply growth, we don’t see sugar prices making a recovery.

Cocoa

The 2016/17 cocoa year has just completed with an 18% growth in production over the previous year. Milder Harmattan winds this year have significantly reduced crop damage in Africa (where 70% of the world’s cocoa comes from). Stocks have risen 26% over the year, increasing the stocks to grinding ratio from 34% in 2015/16 to 42% in 2016/17.

The main crop harvests commence this month in the largest producing countries (Cote d’Ivoire and Ghana). Weather conditions have so far been perfect indicating we are likely to see another surplus year in 2017/18.
On the demand side, grinding data has been stagnant. Despite weak prices, confectionary companies don’t appear to have reversed the thrifting of cocoa they pursued in previous years when prices were higher.

La Niña risks

The US National Oceanic and Atmospheric Administration has increased its probability of a La Niña weather pattern emerging this northern hemisphere winter to 55-60%. However, if the event occurs it is unlikely to change our view of price direction considerably. The weather pattern is likely to be weak if it emerges at all. If anything we expect that dryness in Brazil will continue to hamper the flowering and budding process for coffee (which will continue to be price positive).Dryness in Brazil could promote the gains in sucrose content of cane if accompanied by more sunlight, raising the yield for Brazilian sugar (remaining price negative).

Coolness in West Africa could reduce heat damage, helping to sustain high yields (price negative). But we caution that previous La Ninas have not consistently been production-positive for the crop. According to the International Cocoa Organisation, while El Niños have a statistically significant positive effect on output, La Niña’s positive effects on output fail to be statistically significant.

For more information contact:

Catarina Donat Marques
ETF Securities (UK) Limited
T +44 20 7448 4386
E catarina.donatmarques@etfsecurities.com

Important Information

This communication has been issued and approved for the purpose of section 21 of the Financial Services and Markets Act 2000 by ETF Securities (UK) Limited (“ETFS UK”) which is authorised and regulated by the United Kingdom Financial Conduct Authority (the “FCA”).

Fortsätt läsa
Annons
Klicka för att kommentera

Skriv en kommentar

Din e-postadress kommer inte publiceras. Obligatoriska fält är märkta *

Nyheter

Defence and AI dominate as European Thematic ETF flows hit record $8.73 billion H1 2025

Publicerad

den

Top Performer: Defence (+$7.87 billion) Emerging Themes: Cybersecurity (+$318 million), Uranium (+$253 million) ARK Invest

• Top Performer: Defence (+$7.87 billion)

Emerging Themes: Cybersecurity (+$318 million), Uranium (+$253 million)

European thematic UCITS ETFs posted a dramatic resurgence in the first half of 2025, with net inflows of $8.73 billion year-to-date, according to ARK Invest Europe’s latest quarterly update detailing H1 2025 European thematic ETF flows.

The turnaround marks a decisive reversal from the muted flows of 2024 ($308 million net outflows for the whole of 2024), as investors rotate back into forward-looking, innovation-driven themes with clearer earnings visibility.

Defence remains the dominant thematic allocation, capturing $7.87 billion in combined net inflows between Global ($4.81 billion) and European ($3.05 billion) defence ETFs underscoring its evolution from a tactical trade to a structural portfolio allocation. Maintaining its position as the defining technological theme, AI ETFs saw $904 million in net inflows, with investor appetite fuelled by relentless innovation in large language models, robotics, and autonomous systems.

In the same period, Cybersecurity ETFs continued to rebuild momentum after significant outflows in 2024 ($311 million net outflows for H1 2024), drawing $318 million, reflecting growing investor conviction in cybersecurity as a structural necessity amid rising digital threats.

Clean Energy ETFs saw outflows of $307 million. As policy momentum stalls in key markets, investors are increasingly selective within the energy transition space. Capital is rotating toward subsectors with clearer economic moats, such as nuclear and grid infrastructure. Supporting this sentiment, Uranium ETFs rank fifth at $253 million, reflecting growing investor interest in the nuclear sector as a potential solution to global energy needs.

Healthcare Innovation ETFs recorded net outflows of $279 million. The drawdown reveals investor caution around legacy biotech firms with uncertain drug pipelines and reimbursement risks. Interest is shifting toward AI-driven healthcare platforms offering faster innovation cycles and more scalable business models.

Electric Vehicles and Battery Tech ETFs saw net outflows of $203 million as investor enthusiasm cools amid subsidy rollbacks and plateauing EV demand in major markets. Persistent concerns around battery raw materials and production bottlenecks have further weighed on the theme.

Rahul Bhushan says, “After a cautious 2024, it’s evident that investors are re-engaging with innovation themes that offer clearer earnings visibility and resilience in an increasingly complex macro landscape. We’re seeing investor conviction in megatrends with structural tailwinds, particularly defence, AI, and energy security. Thematics are no longer just tactical bets, they’re core strategic exposures.”

2025/2024 Comparative Study

Thematics are back

After a weak 2024, investor appetite for thematic risk has returned in force:

• H1 2025 total net inflows: +$8.74B

• That’s a sharp reversal from -$791M in H2 2024 and only +$483M in H1 2024

• The rotation is clear: capital is moving back into forward-looking themes with stronger earnings visibility.

Defence is now a structural trade

• Global and Europe Defence saw a combined $7.87B in inflows in H1 2025 and $1.59B in June alone.

• This continues a multi-quarter surge as geopolitical tensions, rising military budgets, and renewed industrial policy drive long-term allocations.

• Defence is no longer a tactical trade—it’s becoming a core exposure.

AI inflows normalise, but conviction remains

• Artificial Intelligence ETFs drew $904M in H1 2025, following $1.47B in H1 2024.

• Inflows may be slowing, but investor conviction is holding firm.

• With earnings delivery now catching up to narrative, AI remains a centrepiece of thematic portfolios.

Cybersecurity shows signs of stabilisation

After brutal outflows in 2024 (-$311M H1, -$260M H2), cybersecurity ETFs finally saw inflows:

• $318M in H1 2025, including $67M in June.

• This rebound suggests investors are once again prioritising digital resilience in an AI-driven world.

Infrastructure themes are quietly regaining traction

• Global and Europe Infrastructure ETFs pulled in $284M in H1 2025, following modest gains in H2 2024.

• Infrastructure is benefiting from government stimulus, defence modernisation, and the reshoring trade.

Uranium’s steady climb continues

• $253M in H1 2025, after $216M in H2 2024 and $67M in June alone.

• Indeed, the $67M in June alone nearly matches the $66M pulled in during the entirety of H1 2024.

• A rare clean energy theme that’s bucking the downtrend, reflecting growing recognition of nuclear as a pragmatic decarbonisation solution.

Clean Energy sentiment is so bad, it might be investable

• Outflows across all periods: -$307M (H1 2025), -$505M (H2 2024), -$409M (H1 2024)

• June 2025: A mere -$8M

• Sentiment is arguably as negative as it’s ever been—yet structural drivers remain in place. The setup for a contrarian rebound is building.

About ARK Invest Europe

ARK Invest International Ltd (”ARK Invest Europe”) is a specialist thematic ETF issuer offering investors access to a unique blend of active and index strategies focused on disruptive innovation and sustainability. Established following the acquisition of Rize ETF in September 2023 by ARK Investment Management LLC, ARK Invest Europe builds on over 40 years of expertise in identifying and investing in innovations that align financial performance with positive global impact.

Through its innovation pillar and the ”ARK” range of ETFs, ARK Invest focuses on companies leading and benefiting from transformative cross-sector innovations, including robotics, energy storage, multiomic sequencing, artificial intelligence, and blockchain technology. Meanwhile, its sustainability pillar, represented by the ”Rize by ARK Invest” range of ETFs, prioritises investment opportunities that reconcile growth with sustainability, advancing solutions that fuel prosperity while promoting environmental and social progress.

Headquartered in London, United Kingdom, ARK Invest Europe is dedicated to empowering investors with purposeful investment opportunities. For more information, please visit https://europe.ark-funds.com/

Fortsätt läsa

Nyheter

UBS Asset Management lanserar sin första aktivt förvaltade ETF

Publicerad

den

UBS Asset Management planerar att erbjuda ett utbud av aktiva ETFer som utnyttjar deras differentierade räntebärande kapacitet, följt senare av en serie avkastningsfokuserade ETFer med optionsöverlägg.
  • UBS Asset Management planerar att erbjuda ett utbud av aktiva ETFer som utnyttjar deras differentierade räntebärande kapacitet, följt senare av en serie avkastningsfokuserade ETFer med optionsöverlägg.
  • Den första som lanseras idag ger tillgång till den aktiva förvaltningsexpertisen hos UBS AMs Credit Investments Group (CIG), en av de ledande förvaltarna av collateralized loan obligations globalt.
  • Den nya UBS EUR AAA CLO UCITS ETF erbjuder investerare exponering mot den högsta kreditkvaliteten inom CLO-strukturen i ett likvidt och kostnadseffektivt omslag.

UBS Asset Management (UBS AM) tillkännager idag lanseringen av sin första aktivt förvaltade ETF, som ger kostnadseffektiv exponering mot de högst rankade trancherna av marknaden för collateralized loan obligation (”CLO”). UBS EUR AAA CLO UCITS ETF kombinerar den aktiva förvaltningsexpertisen hos UBS AMs Credit Investments Group med skalan hos deras väletablerade ETF-erbjudande.

André Mueller, chef för kundtäckning på UBS Asset Management, sa: ”CLOer erbjuder stark avkastningspotential och diversifieringsfördelar. Att navigera på denna marknad kräver dock förståelse för CLO-strukturer, regleringar och riskerna i denna sektor. Vi har kombinerat mer än 20 års ETF-innovation med expertisen hos vår Credit Investments Group för att effektivt och transparent tillhandahålla de högst rankade CLO-värdepapperen. Den aktiva förvaltningsdelen erbjuder kostnadseffektiv exponering med potential att överträffa.”

John Popp, chef för Credit Investments Group på UBS Asset Management, tillade: ”Vi är glada att kunna erbjuda vår expertis inom hantering av CLO-trancher i över två decennier till en bredare investerarbas. Vårt teams djupa kreditkunskap och meritlista genom flera kreditcykler gör oss väl positionerade för att tillhandahålla övertygande investeringar. På dagens marknad anser vi att AAA CLO-skulder erbjuder en attraktiv risk-avkastningsprofil. Att erbjuda denna investering via en ETF kommer att utöka tillgången till denna växande marknad.”

Den aktiva UBS EUR AAA CLO UCITS ETF* erbjuder tillgång till den växande CLO-marknaden genom en likvid och kostnadseffektiv ETF-struktur, vilket innebär:

  • Förbättrad avkastningspotential med strukturellt skydd – AAA CLOer erbjuder högre avkastning jämfört med liknande rankade investeringar, med strukturella egenskaper som har testats genom cykler, utan fallissemang ens under perioder av ekonomisk kris**
  • Portföljdiversifiering – tillgångsslagets rörliga ränta ger betydande diversifieringspotential i samband med en bredare ränteportfölj
  • Aktiv fördel – Credit Investments Group, en av de främsta förvaltarna av säkerställda låneförpliktelser globalt, hanterar dynamiskt risk och avkastning för att fånga marknadsmöjligheter
  • ETF-effektivitetETF-strukturen möjliggör likviditet och kostnadseffektiv tillgång till denna komplexa tillgångsklass

*Fonden är registrerad för försäljning i Österrike, Schweiz, Tyskland, Danmark, Spanien, Finland, Frankrike, Irland, Italien, Liechtenstein, Luxemburg, Nederländerna, Norge och Sverige.

**S&P Global Ratings, “Default, Transition, and Recovery: 2023 Annual Global Leveraged Loan CLO Default and Rating Transition Study”, 27 juni 2024

Fortsätt läsa

Nyheter

AZEH ETF är en aktivt förvaltad ETF som investerar i Asien ex Japan

Publicerad

den

iShares Asia ex Japan Equity Enhanced Active UCITS ETF USD (Acc) (AZEH ETF) med ISIN IE000D5R9C23, är en aktivt förvaltad ETF.

iShares Asia ex Japan Equity Enhanced Active UCITS ETF USD (Acc) (AZEH ETF) med ISIN IE000D5R9C23, är en aktivt förvaltad ETF.

Den börshandlade fonden investerar minst 70 procent i aktier från Asien (exklusive Japan). Upp till 30 procent av tillgångarna kan placeras i private equity-instrument, värdepapper med fast ränta med investment grade-rating och penningmarknadsinstrument. Värdepapper väljs utifrån hållbarhetskriterier och en kvantitativ investeringsmodell.

Den börshandlade fondens TER (total cost ratio) uppgår till 0,30 % p.a. iShares Asia ex Japan Equity Enhanced Active UCITS ETF USD (Acc) är den enda ETF som följer iShares Asia ex Japan Equity Enhanced Active-index. ETFen replikerar det underliggande indexets prestanda genom fullständig replikering (köper alla indexbeståndsdelar). Utdelningarna i ETFen ackumuleras och återinvesteras.

iShares Asia ex Japan Equity Enhanced Active UCITS ETF USD (Acc) är en mycket liten ETF med 9 miljoner euro förvaltade tillgångar. ETFen lanserades den 31 juli 2024 och har sin hemvist i Irland.

Investeringsmål

Fonden förvaltas aktivt och syftar till att uppnå långsiktig kapitaltillväxt på din investering, med hänvisning till MSCI AC Asia ex Japan Index (”Riktmärket”) för avkastning.

Handla AZEH ETF

iShares Asia ex Japan Equity Enhanced Active UCITS ETF USD (Acc) (AZEH ETF) är en europeisk börshandlad fond. Denna fond handlas på flera olika börser, till exempel Deutsche Boerse Xetra och London Stock Exchange.

Det betyder att det går att handla andelar i denna ETF genom de flesta svenska banker och Internetmäklare, till exempel DEGIRONordnet, Aktieinvest och Avanza.

Börsnoteringar

BörsValutaKortnamn
Euronext AmsterdamUSDAXEE
XETRAEURAZEH
London Stock ExchangeGBPAXEE

Största innehav

KortnamnNamnSektorVikt (%)ISINValuta
USDUSD CASHCash and/or Derivatives12.85USD
ISTUSADBLK ICS US TREAS AGENCY DISCash and/or Derivatives9.01IE00B3YQRB45USD
2330TAIWAN SEMICONDUCTOR MANUFACTURINGInformationsteknologi8.55TW0002330008TWD
700TENCENT HOLDINGS LTDKommunikationstjänster5.58KYG875721634HKD
005930SAMSUNG ELECTRONICS LTDInformationsteknologi4.40KR7005930003KRW
9988ALIBABA GROUP HOLDING LTDSällanköpsvaror2.50KYG017191142HKD
GSIFTCASH COLLATERAL USD GSIFTCash and/or Derivatives2.02USD
1299AIA GROUP LTDFinans1.99HK0000069689HKD
000660SK HYNIX INCInformationsteknologi1.27KR7000660001KRW
PDDPDD HOLDINGS ADS INCSällanköpsvaror1.27US7223041028USD

Innehav kan komma att förändras

Fortsätt läsa

21Shares

Prenumerera på nyheter om ETFer

* indicates required

21Shares

21Shares

Populära