
Nyheter
CIO letter regarding the recent market turmoil
Please find below our monthly crypto market update and performance attribution for our Crypto-Index ETPs for July 2024. Additionally, here is a summary of our CIO Samir Kerbage’s letter on recent market events.
• Market volatility was triggered by weak U.S. economic data and an unexpected rate hike by the Bank of Japan, causing significant global market fluctuations.
• Crypto impact come from Yen appreciation / unwinding of carry trades, exacerbated by rumors of a major market maker’s crypto asset liquidation.
• Despite sharp declines, Bitcoin quickly rebounded, showing resilience and attracting investor interest.
• Long-Term Outlook: Short-term volatility doesn’t weaken the long-term investment case for Bitcoin and crypto, which remain strong and increasingly accepted by institutions.
Note our flagship ETP on the Nasdaq Crypto Index (HASH or HDX1) saw inflows in July and currently has ~$150 million in AUM.
Hashdex Crypto Index ETPs: performances (USD) as of end of July 24
• Beta Index ETP – Nasdaq Crypto Index ETP (HASH or HDX1): July +6%, YTD +46%, 12m +109%.
• Smart-Beta Index ETP – Crypto Momentum Index ETP (HAMO or HDXM): July +5%, YTD 73%, 12m +4%.
Market Update – July 2024
In a month marked by heightened volatility, the Nasdaq Crypto Index (NCI) closed with a robust 6.1% gain. Despite an early decline of nearly 10%, the index rebounded, ending the period on a positive note. July started with downward pressure on Bitcoin prices, driven by the continued liquidation of assets confiscated by the German government. Mid-month, the market received a significant boost from the news surrounding U.S. presidential candidate Donald Trump. His recent pro-Bitcoin stance triggered a 9% surge in the NCI.
However, the bullish sentiment was short-lived as the market faced renewed downward pressure from the release of Bitcoin assets held by the Mt. Gox estate. Concurrently, the introduction of Ethereum spot ETFs led to asset redemptions from trusts, further impacting prices. A notable turn of events occurred at the end of the month when Trump, speaking at the Bitcoin conference in Nashville, proposed the creation of a strategic American Bitcoin reserve aimed at reducing national debt.
Nasdaq Crypto Index (NCI) relative to other asset class in June 2024
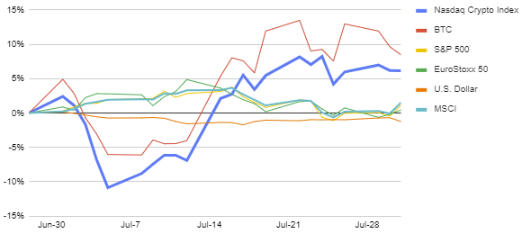
Source: Hashdex, as of 31/07/24.
Globally, markets experienced similar volatility, with the NCI outperforming other asset classes. US and European equity indices posted modest gains of 1.13% and 0.43%, respectively.
July’s Performance attribution
Nasdaq Crypto Index (NCI)
While the NCI showed overall gains, only four tokens within the index saw significant appreciation. XRP led the pack, surging 34% on prospects of settling its legal issues with the SEC. Solana and Bitcoin also posted notable gains of 25% and 8%, respectively.
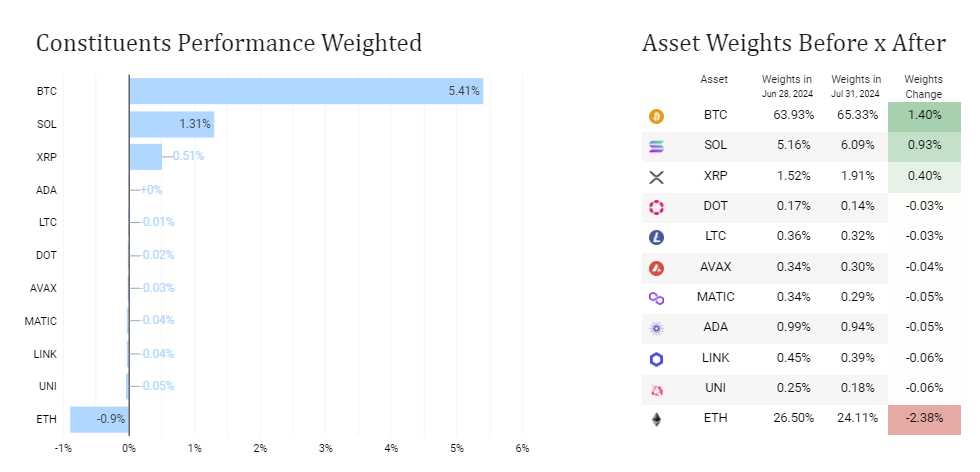
Source: Hashdex, as of 31/07/24.
Crypto Momentum Factor Index
The Momentum index mirrored this positive trend, climbing 4.8%, driven by gains in XRP which rose by 36%.
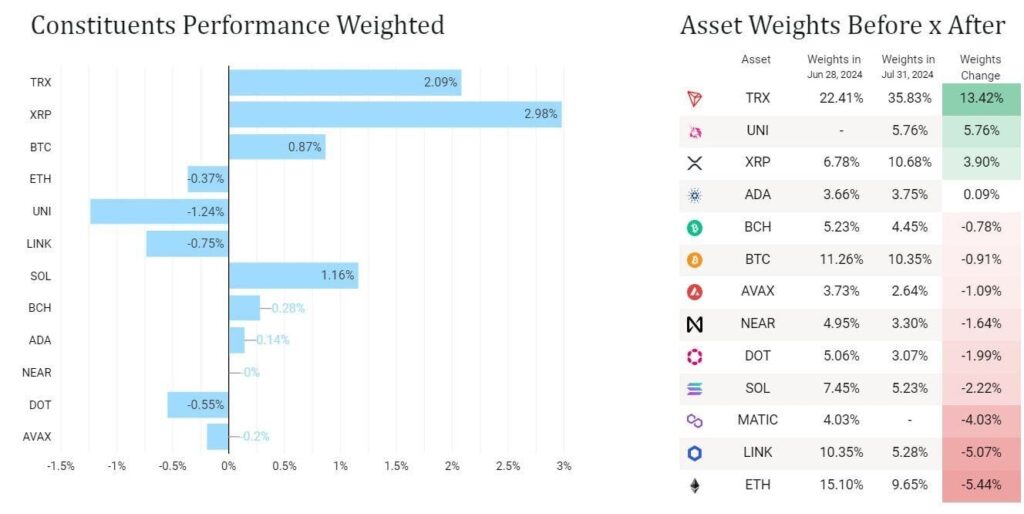
Source: Hashdex, as of 31/07/24.
Correlation (3m) to traditional asset classes
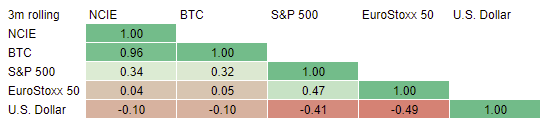
Source: Hashdex, as of 31/07/24.
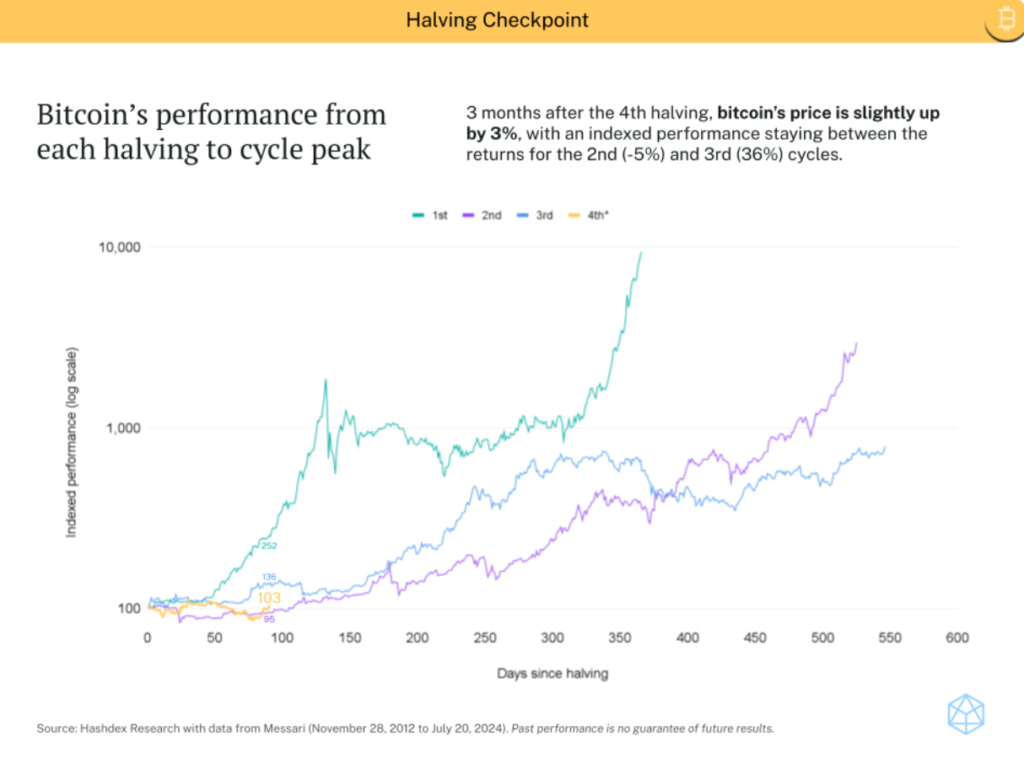
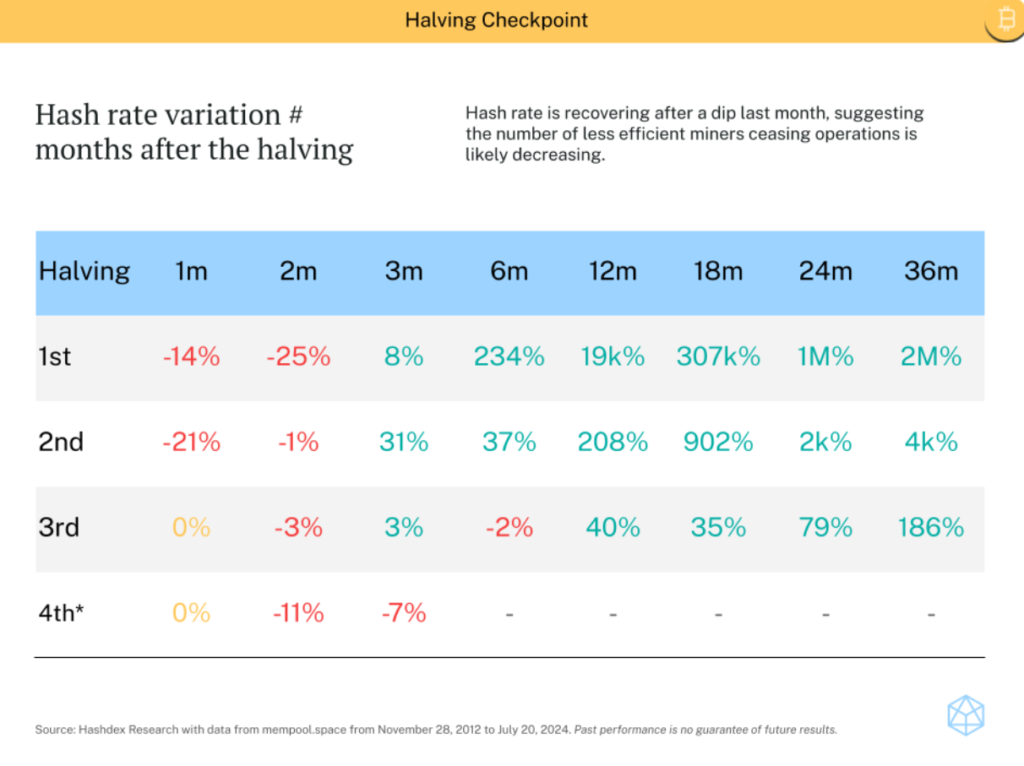
Bitcoin Halving 3 months Checkpoint (as of 20/07/24):
Three months post the 4th Bitcoin halving on 20/04/2024, Bitcoin’s shows a 3% price increase, aligning with trends observed in previous cycles. The hash rate is beginning to recover from last month’s dip, indicating a reduction in the number of less efficient miners exiting the market.
Hashdex Nasdaq Crypto Index Europe
ISIN: CH1184151731 / Tickers: HASH (SIX and Euronext) or HDX1(Xetra) – tradable in USD, EUR, CHF and GBP
Hashdex Crypto Momentum Factor ETP
ISIN: CH1218734544 / Tickers: HAMO (SIX and Euronext) or HDXM (Xetra) – tradable in USD, EUR, CHF and GBP


Europeisk försvars-ETF når 10 miljoner dollar under den första noteringsveckan

Hur investerar jag i ETFer som fokuserar på breda vallgravar?

WELL ETF för den som tror på den globala IT-sektorn

Dogecoin, the meme that made it

VSUI ETN spårar priset på kryptovalutan SUI

Fonder som ger exponering mot försvarsindustrin
Crypto Market Risks & Opportunities: Insights on Bybit Hack, Bitcoin, and Institutional Adoption

Montrose storsatsning på ETFer fortsätter – lanserar Sveriges första globala ETF med hävstång

Warren Buffetts råd om vad man ska göra när börsen kraschar

Svenskarna har en ny favorit-ETF
-
 Nyheter4 veckor sedan
Fonder som ger exponering mot försvarsindustrin
-

 Nyheter3 veckor sedan
Crypto Market Risks & Opportunities: Insights on Bybit Hack, Bitcoin, and Institutional Adoption
-
 Nyheter2 veckor sedan
Montrose storsatsning på ETFer fortsätter – lanserar Sveriges första globala ETF med hävstång
-
 Nyheter4 veckor sedan
Warren Buffetts råd om vad man ska göra när börsen kraschar
-
 Nyheter3 veckor sedan
Svenskarna har en ny favorit-ETF
-

 Nyheter2 veckor sedan
MONTLEV, Sveriges första globala ETF med hävstång
-

 Nyheter4 veckor sedan
Fastställd utdelning i MONTDIV mars 2025
-

 Nyheter2 veckor sedan
Sju börshandlade fonder som investerar i försvarssektorn